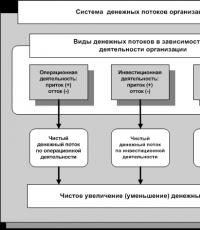
Testing the deformation behavior of polymers. Polymer testing Increased temperature causes changes in mechanical properties
Testing of the properties of thermoplastic wood-polymer composite materials abroad is carried out in accordance with the methods indicated below:
- Wear test on Taber machine ISO 3537 (DIN 52347, ASTM D1044)
- Brinell hardness ISO 2039-1 (DIN 53456)
- Rockwell hardness ISO 2039-2 - Shore hardness ISO 868 (DIN 53505, ASTM D2240)
- Impact Strength Concept
- Impact strength ISO 180 Izod (ASTM D256)
- Heat resistance according to Vicat ISO 306 (DIN 53460, ASTM D1525)
- Deformation heat resistance and deformation heat resistance under load ISO 75 (DIN 53461, ASTM D648)
- Deformation heat resistance (HDT) and amorphous and semi-crystalline plastics
- Ball indentation EC335-1
- Thermal Conductivity ASTM C 177
- Relative thermal conductivity index, RTI (UL 746B)
- Coefficient of Linear Thermal Expansion ASTM D696, DIN 53752
- General UL94 Flammability Information
- Brief Description of UL94 Classification Categories
- Category UL94HB
- Category UL94V0, V1, V2
- Category UL94-5V
- CSA Flammability (CSA C22.2 No. 0.6 Test A)
- Oxygen-limited flammability index ISO 4589 (ASTM D 2863)
- Glow wire test IEC 695-2-1
- Needle flame tests IEC 695-2-2
- Dielectric strength IEC 243-1
- Surface resistivity IEC 93 (ASTM D257)
- Volume resistivity IEC 93 (ASTM D257)
- Relative dielectric constant IEC 250
- Dissipation factor IEC 250
- Arc resistance ASTM D495
- Comparative Tracking Index (Comparative Breakdown Index) IEC 112
- CTI-M tests
- PLC categories (UL746A)
- Haze and Light Transmission ASTM D1003
- Gloss DIN 67530, ASTM D523
- Haze and gloss
- Refractive index DIN 53491, ASTM D542
- Density ISO 1183 (DIN 53479, ASTM D792)
- Water absorption ISO 62 (ASTM D570)
- Molding shrinkage ISO 2577 (ASTM D955)
- Melt Flow Rate/Melt Index ISO 1133 (DIN 53735, ASTM D 1238)
- Melt Volume Flow/Melt Volume Index ISO 1133 (DIN 53735, ASTM D 1238)
- Melt viscosity DIN 54811
- Practical application of MV, MFR/MFI, MVI characteristics in production
1. Mechanical tests
Strength, deformation and tensile modulus ISO R527
(DIN 53455, DIN 53457, ASTM D638M)
The basis for understanding the properties of a material is information about how the material reacts to any load. By knowing the amount of deformation produced by a given load (stress), the designer can predict the response of a particular product to its operating conditions. Tensile stress-strain relationships are the most widely published mechanical properties for comparing materials or designing specific products.
Test speeds:
- Speed A – 1 mm/min – tensile modulus.
- Speed B - 5 mm/min - Tensile stress diagram for glass fiber filled resins.
- Speed C – 50 mm/min – tensile stress diagram for unfilled resins.
Tensile stress-strain relationships are determined as follows. The double blade shaped sample is stretched at a constant rate and the applied load and elongation are recorded. After this, stresses and strains are calculated:
Other mechanical properties determined from the stress-strain relationship are:
Strength and flexural modulus ISO 178 (DIN 53452, ASTM D790)
Flexural strength is a measure of how well a material resists bending, or "how stiff the material is." An ordinary, simply supported rod is loaded in the middle of the span: thereby creating a three-point load. On a standard testing machine, the loading tip presses onto the sample at a constant speed of 2 mm/min.
To calculate the flexural modulus of elasticity, a curve of deflection versus load is constructed from the recorded data. Starting from the initial linear part of the curve, use a minimum of five load and deflection values.
Flexural modulus (the ratio of stress to strain) is most often mentioned when referring to elastic properties. The flexural modulus of elasticity is equivalent to the slope of the tangent line to the stress/strain curve in that part of the curve where the plastic has not yet deformed.
The values of stress and modulus of elasticity in bending are measured in MPa.
Wear test on Taber machine ISO 3537 (DIN 52347, ASTM D1044)
 |
Rice. 4: Wear test on Taber machine |
These tests measure the amount of abrasion loss by abrading the sample using a Taber machine. The sample is fixed on a disk rotating at a frequency of 60 rpm. The forces created by the weights press the abrasive wheels against the sample. After a specified number of cycles, the tests are stopped. The mass of abrasion loss is defined as the mass of particles that were removed from the sample: this mass is expressed in mg/1000 cycles. Abrasive wheels are actually sharpening stones in the shape of a circle. Various types of these circles are used.
Comparison of ISO (International Organization for Standardization) and ASTM (American Society for Testing and Materials) methods.
Application of the ISO method not only changes the test conditions and test mandrel dimensions (compared to the ASTM method), but also requires standardized mold designs and molding conditions in accordance with ISO 294. This may result in differences in published values - not due to a change in the properties of the material, but due to a change in the test method. According to the ASTM method, the test specimen has a thickness of 3 mm, while the ISO has selected specimens with a thickness of 4 mm.
2. Hardness tests
Comparison of Brinell, Rockwell and Shore hardnesses
The Rockwell test determines the hardness of plastics based on the elastic recovery of the sample deformation during testing. This differs from the Brinell and Shore hardness tests: in these tests, hardness is determined by the depth of penetration under load and, therefore, excludes any elastic recovery of deformation of the material.
Therefore, Rockwell values cannot be directly correlated with Brinell or Shore hardness values.
The Shore A and D hardness ranges can be compared with the Brinell hardness ranges. However, there is no linear correlation.
Brinell hardness ISO 2039-1 (DIN 53456)
A polished hardened steel ball with a diameter of 5 mm is pressed into the surface of the test sample (at least 4 mm thick) with a force of 358 N. 30 s after application of the load, the depth of the indentation is measured. Brinell hardness H 358/30 is calculated as the “applied load” divided by the “imprint surface area”. The result is expressed in N/mm 2
Rockwell hardness ISO 2039-2
The Rockwell hardness number directly relates to the hardness of the imprint on the plastic: the higher the number, the harder the material. Due to the slight overlap of Rockwell hardness scales for the same material, it is possible to obtain two different numbers on two different scales, and both of these numbers may be technically correct
The indenter, which is a polished hardened steel ball, is pressed into the surface of the test sample. The diameter of the ball depends on the Rockwell scale used. The sample is loaded with a “minor load”, then with a “main load”, and then again with the same “minor load”. The actual measurement is based on the total penetration depth, this depth is calculated as the total depth after the main load is removed minus the elastic recovery after the main load is removed and minus the penetration depth at light load. The Rockwell hardness number is calculated as "130 minus the penetration depth in units of 0.002 mm."
Rockwell hardness numbers should be between 50 and 115. Values outside these limits are considered inaccurate: the measurement must be repeated again using the next harder scale. The scales increase in hardness from R through L to M (with increasing hardness of the material). The loads and diameters of the indenters are indicated in more detail in the table.
If a softer material requires a scale less severe than the R scale, then the Rockwell hardness test is not appropriate. Then you can use the Shore hardness method (ISO 868), which is used for low-modulus materials.
Shore hardness ISO 868 (DIN 53505, ASTM D2240)
Shore hardness values are the scale readings obtained when a specific steel rod penetrates the plastic. This hardness is determined by two types of scleroscopes, both of which have calibrated springs to apply a load to the indenter. Scleroscope A is used for softer materials, and scleroscope D is used for harder materials.
Shore hardness values vary:
- from 10 to 90 for Shore type A scleroscope - soft materials,
- from 20 to 90 for Shore type D scleroscope - hard materials.
If the measured values are >90A, the material is too hard and a scleroscope D must be used.
If the measured values
There is no simple relationship between the hardness measured by this test method and other fundamental properties of the material being tested.
3. Impact tests
Impact Strength Concept
In standard tests, such as tensile and bending tests, the material absorbs energy slowly. In reality, materials very often quickly absorb the energy of an applied force, for example, forces from falling objects, impacts, collisions, falls, etc. The purpose of impact testing is to simulate such conditions.
The Izod and Charpy methods are used to study the properties of certain samples under given impact stresses and to evaluate the brittleness or toughness of the samples. Test results from these methods should not be used as a source of data for component design calculations. Information about typical material properties can be obtained by testing different types of test specimens prepared under different conditions, varying the notch radius and test temperature.
Tests using both methods are carried out on a pendulum impact driver. The sample is clamped in a vice, and a pendulum impact driver with a hardened steel impact surface of a certain radius is released from a given height, which causes the sample to shear under a sudden load. The residual energy of the pendulum pile driver lifts it upward. The difference between the fall height and the return height determines the energy expended on the destruction of the test sample. These tests can be carried out at room temperature or at reduced temperatures to determine cold brittleness. The test samples may differ in the type and size of cuts.
The results of drop weight impact tests, such as the Gardner method or curved plate test, depend on the geometry of the drop weight and the support. They can only be used to determine the relative ranking of materials. Impact test results cannot be considered absolute unless the geometry of the test equipment and specimen meets the requirements of the end application. It can be expected that the relative ranking of materials according to the two test methods will be the same if the nature of destruction and impact velocities are the same.
Interpreting Impact Test Results - Comparing ISO and ASTM Methods
Impact characteristics can be highly dependent on sample thickness and molecular orientation. The different specimen thicknesses used in the ISO and ASTM methods can have a very significant effect on the impact strength values. Changing the thickness from 3 mm to 4 mm can even result in a change in failure mode from ductile to brittle due to the influence of molecular weight and thickness of the notched specimen using the Izod method, as demonstrated for polycarbonate resins. Materials that already show a brittle fracture pattern at a thickness of 3 mm, for example, materials with mineral and fiberglass fillers, are not affected by changing the thickness of the sample. Materials with modifying additives that increase impact strength have the same properties.

Rice. 10: Influence of thickness and molecular weight of the notched sample on the results of Izod impact testing of polycarbonate resins
It is necessary to clearly understand that:
- It is not the materials that have changed, but only the test methods;
- the mentioned transition from ductile to brittle fracture plays an insignificant role in reality: the vast majority of designed products have a thickness of 3 mm or less
Impact strength ISO 180 Izod (ASTM D256)
Izod impact testing of notched specimens has become a standard method for comparing the impact strength of plastics. However, the results of this test method do not closely correspond to the impact response of the molded product in a real-world environment. Due to the different notch sensitivities of materials, this test method may allow some materials to be rejected. Although the results of these tests are often requested as meaningful measures of impact resistance, these tests tend to measure the notch sensitivity of the material rather than the ability of the plastic to withstand impact. The results of these tests are widely used as a reference for comparing the impact strengths of materials. Izod impact testing of notched specimens is best suited for determining the impact strength of products that have many sharp corners, such as ribs, intersecting walls, and other stress concentration areas. When testing Izod impact strength of unnotched specimens, the same loading geometry is used, except that the specimen is unnotched (or is clamped in a vice in an inverted position). This type of test always gives better results than Izod notched tests due to the absence of stress concentration points.
The impact strength of notched samples using the Izod method is the impact energy expended to destroy the notched sample, divided by the original cross-sectional area of the sample at the notch site. This strength is expressed in kilojoules per square meter: kJ/m 2. The sample is clamped vertically in the vise of an impact driver.
- ISO 180/1A designates specimen type 1 and notch type A. As can be seen in the figure below, specimen type 1 is 80mm long, 10mm high and 4mm thick.
- ISO 180/1O represents the same sample 1 but clamped in an inverted position (reported as "uncut").
The ASTM specimens have similar dimensions: the same radius at the base of the notch and the same height, but differ in length - 63.5 mm and, more importantly, in thickness - 3.2 mm.
ISO test results are determined as the impact energy in joules expended to fracture the test specimen divided by the cross-sectional area of the specimen at the notch location. The result is expressed in kilojoules per square meter: kJ/m 2.
ASTM test results are determined as the impact energy in joules divided by the notch length (i.e., specimen thickness). They are expressed in joules per meter: J/m. The practical conversion factor is 10: i.e. 100 J/m is equal to approximately 10 kJ/m2.
Different sample thicknesses may result in different interpretations of “toughness,” as shown separately.

Rice. 11: Samples for impact strength measurements
Charpy Impact Strength ISO 179 (ASTM D256)
ISO designations reflect the type of specimen and the type of cut:
- ISO 179/1C designates specimen type 2 and notch type CI;
- ISO 179/2D denotes a type 2 specimen, but uncut.
The main difference between the Charpy and Izod methods is the method of installing the test sample. When testing using the Charpy method, the sample is not clamped, but is freely placed on a support in a horizontal position.

Rice. 13: Charpy impact strength measurement method and instrument for measuring it
The samples used according to the DIN 53453 method have similar dimensions. The results for both the ISO and DIN methods are determined as the impact energy in joules absorbed by the test specimen divided by the cross-sectional area of the specimen at the notch location. These results are expressed in kilojoules per square meter: kJ/m2.
Independent selection of a polymer, ensuring full compliance of the material with the intended operating conditions, is difficult. In addition to the need to consider multiple impacts, both permanent and short-term, it is also necessary to consider a combination of impacts. After all, one material with excellent mechanical properties can collapse when exposed to the slightest load in contact with any chemical or temperature unfavorable for plastic, while another, initially with relative mechanical characteristics, is able to withstand the same load under similar conditions.
To be able to compare the properties of various plastics, manufacturers of polymer blanks conduct a series of tests. Typically, indicators are entered into special tables, the use of which simplifies the process of choosing a polymer. However, it is worth noting that all these indicators are not maximum or minimum. These are averages of normal tests performed under standard conditions and are intended to be a projection of material properties only. Naturally, if any condition changes, the test data may be completely different from those declared by the manufacturer.
In any case, individual tests are necessary - only they can confirm the possibility of using the plastic you have chosen. To select one material, it is not advisable to carry out individual tests of each type of polymer and its modifications; therefore, polymers that do not meet operating conditions are first “screened out.” The “screening” is precisely carried out on the basis of the data provided by the manufacturers of polymer blanks. Then there are polymers, the effective use of which is possible with a high probability. At this stage you need to be extremely careful, because... Test methods or conditions for materials from different manufacturers may be different. The first step towards making a choice is to collate and compare the test results produced by the manufacturer. Typically, for engineering and high temperature polymers, testing is carried out on:
- Mechanical properties
- Temperature properties
- Electrical properties
- Chemical properties
- Other properties (physical, optical, etc.)
But having data on all materials in hand before comparison, you need to pay attention to the methods that were used in the testing process. Considering that the Russian GOST standards we are used to are not valid throughout the world, and test methods in different countries often differ, comparison of test performance in accordance with GOST and any ISO, ASTM, EN DIN is difficult. And even if the testing processes, equipment and calculations of indicators according to GOST and ISO are the same, the samples or conditions may be different, therefore, the test results cannot be used to accurately compare materials. The most commonly used standards for testing plastics are: International Test Methods for Polymeric Materials (ISO), Standard Test Methods for Thermoplastic Materials (ASTM), Russian Standards for Test Methods for Plastics (GOST). Let's look at some of the most popular test methods, and also compare some of them with international standards.
Water absorption (GOST 4650-80). The essence of the methods is to determine the mass of water absorbed by the sample as a result of its exposure to water for a specified time at a certain temperature. The standard complies with ISO 62-80 and ASTM D570.
Flammability (GOST 21207-81). The method consists of determining the length of the charred part of the sample and the time it burns as a result of exposure to a gas burner flame for 60 seconds.
Combustion (GOST 28157-89). The essence of the method is to determine the speed of flame propagation along a horizontally and/or vertically fixed sample. The general test principle is similar to UL Standard 94 but the test parameters are different.
Melting point (GOST 21533-76). The essence of the method is to measure the temperature at which birefringence disappears from a plastic sample heated at a controlled speed on the stage of a polarizing microscope. The method is used for crystallizing plastics. The standard complies with the international standards ISO 3146-74 in terms of the PHA method and ISO 1218-75 method A in terms of the BA method.
Tensile (GOST 11262-80). The method is based on stretching a sample at a set strain rate, at which the following indicators are determined: elongation, yield strength, load-elongation curve, tensile strength, tensile strength, tensile yield strength, elongation at break, elongation at maximum load, elongation at yield strength, etc. Mechanical tensile tests (stress, deformation, elastic modulus, yield strength, tensile strength, breaking strain, proportional limit, etc.) according to international standards are determined in accordance with ISO 527 (DIN 53455 , 53457, ASTM D 638M).
Compression (GOST 4651-82). The method is based on loading the test sample with a compressive increasing load at a set strain rate. With this method, the following indicators are determined: compressive stress, compressive strain, compressive stress at the yield point, compressive failure stress, flexibility coefficient, etc.
Static bending (GOST 4648-71). The essence of the method is that the test sample, lying freely on two supports, is briefly loaded in the middle between the supports. In this case, the following is determined: bending stress and deflection value at the moment of destruction for plastics that fail at a given deflection value or before reaching this value; bending stress at a given deflection value for plastics that do not fail at a given deflection value or before reaching this value; bending stress at maximum load for plastics in which, at a given deflection value or before reaching this value, the load passes through a maximum; bending stress at failure or maximum load, when the deflection exceeds the specified deflection value, if this is provided for in the regulatory and technical documentation for plastic. Mechanical bending tests according to international standards are defined in accordance with ISO 178 (DIN 53452, ASTM D 790).
Impact strength (strength).
According to Charpy (GOST 4647-80). Determination of Charpy impact strength under certain conditions is used to study the behavior of plastic samples under impact tests, as well as to determine impact strength. The essence of the method is a test in which a sample lying on two supports is subjected to a pendulum impact, with the line of impact located in the middle between the supports and directly opposite the notch for notched samples. The standard is fully compliant with ISO 179-82 (ASTM D256). This method has a wider coverage area compared to ISO 180.
According to Izod (GOST 19109-84). The essence of the method is to destroy a cantilever-fixed sample with a notch by striking a pendulum across the sample at a certain distance from the place of fastening. The standard complies with ISO 180-82 (ASTM D256) except for the tolerance on specimen thickness.
Modulus of elasticity in tension, compression and bending (GOST 9550-81).
Stretching. The essence of the method is to determine the tensile modulus of elasticity as the ratio of the increment in stress to the corresponding increment in relative elongation. The tensile modulus as well as other tensile tests according to international standards are determined in accordance with ISO 527-2 (DIN 53455, 53457, ASTM D 638M).
Compression. The essence of the method is to determine the modulus of elasticity in compression as the ratio of the increment in stress to the corresponding increment in the relative compressive strain. The compressive modulus of elasticity according to international standards is determined in accordance with ISO 604.
Bend. The essence of the method is to determine the modulus of elasticity in bending as the ratio of the increment in stress to the corresponding increment in relative deformation. The flexural modulus as well as other flexural tests according to international standards are determined in accordance with ISO 178 (DIN 53452, ASTM D790).
Tensile creep (GOST 18197-82). The essence of the method is to apply a constant tensile load to the test sample for a long time under conditions of constant temperature and humidity. The behavior of plastics when tested for creep in tension characterizes their strength under long-term exposure to static load. The results of tensile creep tests can be used to predict the behavior of plastic parts (their deformation and failure) under the same test conditions and plastic use.
Shear strength (GOST 17302-71). The method consists in determining the magnitude of the shearing force when cutting a sample along two planes.
Abrasive wear (GOST 11012-69). The essence of the method is to determine the reduction in sample volume as a result of abrasion. The abrasion index is intended for a comparative assessment of the wear of plastics during abrasion without lubrication. Equipment and test modes according to GOST and ISO are different. International wear test methods are specified in ISO 3537 (DIN 52347, ASTM D1044) and are carried out on a Taber machine.
Friction coefficient (GOST 11629-75). A method for determining the coefficient of friction of plastics by sliding samples along a steel plane of a counterbody without lubrication.
Determination of hardness.
(GOST 4670-91, ISO 2039/1-87). Method of indentation of a loaded ball indenter.
(GOST 24622-91, ISO 2039/2-87). The Rockwell hardness index is directly dependent on the hardness of the plastic when indented by the indenter; the higher the Rockwell hardness index, the harder the material.
(GOST 24621-91, ISO 868-85). Shore hardness is determined by indentation using two types of durometers.
Methods for determining hardness according to both international and Russian standards are identical.
Density (GOST 15139-69). The essence of the method is to determine the density of a substance by the ratio of the mass of the sample to its volume, determined directly by weighing and measuring, or by the displaced volume of liquid for samples of irregular or difficult to measure shape. The general test principle is similar to ISO 1183 (DIN 53479, ASTM D792).
Average coefficient of linear thermal expansion (GOST 15173-70). The essence of the method is to test a plastic sample, in which the following is determined: the average coefficient of linear thermal expansion in the minimum temperature range; the average coefficient of linear thermal expansion in a specified temperature range. The general principle of the method is similar to ASTM D696, DIN 53752.
Specific heat capacity (GOST 23630.1-79). The standard establishes a method for determining specific heat capacity in the temperature range from - 100°C to +400°C. The essence of the method is to measure the heat flux absorbed by the sample during the monotonic heating mode of a dynamic calorimeter, characterized by the temperature lag time on a heat meter with a known effective thermal conductivity. According to international regulations, specific heat capacity is determined in accordance with ISO 22007-4:2008.
Thermal conductivity (GOST 23630.2-79). The standard establishes a method for determining specific heat capacity in the temperature range from - 100°C to +400°C. The essence of the method is to measure the thermal resistance of a sample during a monotonic heating mode at specified test temperatures. According to international regulations, thermal conductivity is determined in accordance with ISO 22007-4:2008.
Vicat softening temperature (GOST 15088-83). The essence of the method is to determine the temperature at which a standard indenter, under the influence of force, penetrates into the test sample, heated at a constant speed, to a depth of 1 mm. The standard is fully compliant with ISO 306 (DIN 53460, ASTM D1525).
Bending temperature under load (GOST 12021-84). The essence of the method is to determine the temperature at which the test sample, horizontally located on two supports, under the influence of a constant load (at a stress of 0.45 or 1.8 MPa) and heated at a constant speed, bends by a given amount. The standard corresponds to ISO 75 (DIN 53461, ASTM D648), however, due to the different sizes of the test samples, the values of deformation heat resistance measured using ISO methods may be lower. Also, for the ASTM method, a pressure of 1.82 MPa is used.
Tests for resistance to temperature (GOST 9.715-86). The resistance of a material to temperature is established based on the test results of material samples when determining: temperature ranges at which chemical and (or) physical processes occur in the material, including processes accompanied by a change in the mass of the sample; the range of stresses and temperatures in which samples retain their shape and integrity (for engineering plastics).
Aging of plastics under the influence of natural and artificial climatic factors (GOST 9.708-83). The essence of the method is that samples are exposed to natural climatic factors at climatic stations for a given test duration and resistance to the specified impact is determined by changes in one or more property indicators (physical-mechanical, electrical, optical, appearance, etc. ).
Transcript
1 53 In the laboratory, friction and wear testing is often carried out using mechanized tribometers, and scientists have been able to develop a wide variety of standardized and non-standardized methods that can be used to determine the tribological characteristics of materials. In real operating conditions, predicting the behavior of materials under friction is quite difficult for a number of reasons: 1. A wide range of combinations of materials moving over each other and the surface roughness of bodies made from these materials; 2. The ability to use a variety of lubricants that affect the intensity of friction between bodies; 3. Nonlinearity of the relationship between load (contact pressure), movement speed and friction coefficient; 4. The influence of temperature on the value of the coefficient of friction and the release of heat when two bodies rub against each other Mechanical tests of polymer films In subsequent chapters of this book, tables and graphical dependencies will be presented, which will present the permeability properties and values of various mechanical characteristics of films obtained from various polymer materials. The values of many, but not all, property indicators depend on temperature, relative deformation, relative humidity and other factors. This section presents some standard methods that are used in determining mechanical properties. More detailed information regarding the methods used to determine mechanical property values is presented in this chapter. Standard test methods are usually developed and published by specialists from the two organizations. The first of these organizations is ASTM International, which is also called the American Society for Testing and Materials. This organization publishes standardized test methods in the form of ASTM standards. The second is the International Organization for Standardization (or ISO for short), which is also actively involved in similar activities. These organizations specialize not only in the development of testing methods for plastics, but also develop technical standards, if necessary, for any other areas and industries. The standards of both of these organizations are used by specialists everywhere, but it should be noted that the methods described in the standards of different organizations do not always exactly replicate each other. However, sometimes ASTM and ISO standards are exactly the same as each other, but sometimes the standards may have different procedures or different test conditions, and therefore the results obtained using the methods described in the standards of different organizations are not always the same. can be directly compared with each other. Very often, property indicators measured using different standards can have approximately the same values, but most often, at least to a minimal extent, they differ from each other. The plastics from which the films are made can also be used in the production of injection molded products. Very often, the properties specified by film manufacturers are actually measured by testing injection molded samples from the same material from which the film product is made. However, it should be understood that when determining the properties of films and polymers
2 54 2. Basic properties of films obtained from plastics and elastomers of the materials from which these products are made, it is more advisable to test film samples, since the peculiarities of the methods for producing films can lead to the fact that the polymer will form a certain molecular structure in such products, which, in turn, will have some special, unique properties. Methods for producing films and the influence of production process parameters on the properties of film products are presented in more detail in Chapter 3. However, sometimes in practice it is not possible to measure the values of certain characteristics by testing film samples. In this case, the results of testing samples obtained from the same brand of polymer by injection molding are “better than nothing at all.” Tensile mechanical properties Determination of the values of tensile mechanical characteristics is carried out by gradually stretching a sample of the material under study and measuring the maximum load that can withstand test sample. Such tests are carried out on specialized equipment, in particular on the Instron Universal Materials Testing Machine. Before carrying out tensile tests, it is necessary to measure the initial dimensions of the samples under study. Knowing this information, the load and deformation values obtained as a result of tests can be converted, thereby constructing a deformation curve, that is, a curve of deformation versus stress. A large amount of very important information can be obtained from the deformation curve. Tensile testing methods for plastics are described in the following standards: ASTM D882-1 Standard Test Method for Tensile Properties of Thin Plastic Sheeting; ISO standard “Plastics Determination of tensile properties Part 3: Test conditions for films and sheets”; JIS K 7127:1999 Plastics Determination of tensile properties Part 3: Test conditions for films and sheets. Figure shows a general view of the Instron Universal Materials Testing Machine, a diagram of the testing of injection molded samples and film samples, and the shape of the test samples. The clamps that are used to hold film samples differ to some extent from the clamps shown in Fig. In addition, the surfaces of the clamps in contact with film samples are most often rubberized, which makes it possible to hold even fairly thin films in the clamps quite reliably and not damage them. This is a test sample. The ratio of the width of the test specimens to their thickness shall be at least 8:1. If anisotropic materials are tested, then samples are cut from the original web in two directions parallel to the direction of extrusion (NE, longitudinal direction), that is, in the direction of material orientation, as well as in the perpendicular direction (transverse direction, TD). Using this machine, during testing, it is possible to directly obtain deformation curves (stress-strain curves) similar to those presented in Fig. By analyzing such deformation curves, specialists can obtain a lot of useful and very important information about the mechanical characteristics of polymer materials.
3 55 clamp (traverse, head) moves at a constant speed film sample sample for testing, cut out obtained from the original film injection molding method movable clamp (traverse, head) jaws of the clamp sample for testing fixed clamp (traverse, head) load sensor (strain cell) Fig. Instron Universal Material Testing Machine (Photo courtesy of Instron Corporation) 7 6 F C D H stress, MPa B A E K 1 G strain/elongation, % Fig. Typical view of the strain curve (strain versus stress curve), which can be distinguished a number of important points 1
4 56 2. Basic properties of films obtained from plastics and elastomers A number of very important points can be identified in Fig. These points include: Point A is called the Proportional Limit. Up to point A, a linear dependence of the magnitude of stress on the magnitude of relative deformation is observed. Point B is called the Elastic Limit. Before this point, only the elastic, reversible component of deformation appears in the sample, and after point B the sample begins to deform irreversibly. Point C is called the Yield Point. After point C, the material begins to deform without additional load. Point D is called Ultimate Strength. At this point the maximum stress value on the deformation curve is reached. Point E is called the Breakpoint. In table Table 2.3 provides information on what parameters can be determined from the deformation curve presented in Fig. Table 2.3. Tensile mechanical properties determined from a stress-strain curve according to ASTM D882 Characteristic Definition Elongation at break Elongation at yield Tensile strength (maximum stress value) Yield strength Tensile strength Limit value of tensile stresses Tensile modulus of elasticity (first-order modulus of elasticity) Section modulus (secant modulus) Resistance to fracture Corresponds to the value of the relative elongation at which the sample breaks, point J in Fig. Corresponds to the value of the relative elongation at which the sample begins to flow, point G in Fig. Corresponds to the value of stress at which the sample breaks, point K in fig Corresponds to the stress value at which the sample begins to flow (the sample continues to elongate and deform at a constant stress value), point F in fig The magnitude of tensile stresses at a given value of relative deformation The maximum value of tensile stresses that can arise in the material before its failure, point H in Fig. The ratio of the magnitude of tensile stresses to the magnitude of the relative elongation of a material sample in the region of elastic deformation (from the zero point to point B in Fig. 2.13) on the deformation curve. The “tangential” (“tangent”) elastic modulus is determined by the angle of inclination of the deformation curve in the region of elastic deformation. Very often this parameter is also called Young's modulus or simply elastic modulus. The indicator is determined by the angle of inclination of the line connecting the zero point and the point on the deformation curve corresponding to a certain value of relative elongation. The amount of energy that must be transferred per unit volume of the sample for its destruction. during tensile testing. The indicator is determined by the surface area under the deformation curve. Most plastics exhibit one of four possible behavior when stretched. Thus, all plastics are characterized by one of four types
5 57 deformation curves presented in Fig. The values of the slope angles of deformation curves during real tests and determining the dependence of stress on deformation may differ to some extent, however, in any chapter of this book the reader will be able to see that all curves characteristic of plastics, to a greater or lesser extent degrees correspond to one of these four forms. 125 stress, MPa hard and brittle material hard and strong material hard and viscous material soft and strong (viscous) material deformation (relative elongation), % Fig. Various types of deformation curves characteristic of plastics The rigidity of plastics is determined by the force that must be applied to the test sample to ensure its deformation. The modulus of elasticity is precisely a measure of the rigidity of plastics. In the case of amorphous plastic samples cooled to a much lower temperature compared to the glass transition temperature, the loading energy is spent on bending and stretching (deformation) of bonds in the polymer chain that is the basis of the plastic. When heated to the glass transition temperature Tst, the rigidity of amorphous plastic samples changes very significantly. The value of the elastic modulus in this case can decrease even by three orders of magnitude. With further heating of samples of polymer materials, between the chains of which there are a small number of cross-links, above the glass transition temperature, the value of the elastic modulus may even decrease to zero. However, in the case of higher molecular weight polymers, such as polymethyl methacrylate, the macromolecules can be highly intertwined, which allows the material to maintain a fairly high elastic modulus value even when heated to the decomposition temperature. The same phenomenon is also observed in the case of cross-linked polymers, which are also able to retain their elasticity when heated. It should be remembered that the higher the degree of cross-linking of the material, i.e. The greater the number of cross-links formed between polymer chains, the greater the elastic modulus of the material. If the material is at least partially crystallizing, then this can also limit the mobility of molecular chains even at temperatures exceeding Tst, as a result of which the value of the elastic modulus of the material also increases. As the degree of crystallinity of a material increases, its rigidity also increases. Some
6 58 2. Basic properties of films obtained from plastics and elastomers; polymers transform into a molten (viscous-flow) state in a fairly wide temperature range. In this case, the value of the elastic modulus can gradually decrease throughout this temperature range down to the melting temperature (Tm). The mentioned phenomena are presented in Fig. 2.15, in which: Curve A is characteristic of an amorphous polymer with an average molecular weight. Curve B is characteristic of an amorphous polymer with a high molecular weight, and therefore the macromolecules of such a polymer can be intertwined. Curve C is typical for cross-linked material with a low degree of cross-linking. Curve D is typical for cross-linked material with a high degree of cross-linking. Curve E is characteristic of a polymer with a low degree of crystallinity (partially crystallizing polymer). Curve F is characteristic of a polymer with a high degree of crystallinity (crystalline polymer). 12 Modulus of elasticity of the material, MPa T st C F E D T pl Decomposition temperature 5 A B Temperature, C Fig. Schematic representation of the curves of the dependence of the elastic modulus of a polymer on various factors Mechanical properties during bending For polymer films, scientists sometimes determine the mechanical properties during bending, but in most cases such characteristics analyzed by testing samples produced from these polymers using injection molding. Test conditions for determining the flexural mechanical properties of materials are described in the following standards: ASTM D79-3 Standard Test Methods for Flexural Properties of Unreinforced and Reinforced Plastics and Electrical Insulating Materials);
7 59 ISO Standard 178:21 Plastics Determination of flexural properties. When determining the mechanical characteristics during bending, the test sample is placed on two supports (a beam fixed at two ends), after which a load is applied to the center of the sample, as a result of which the sample begins to bend (Fig. 2.16). Typically, an Instron universal testing machine is used to perform this type of testing. Maximum stress and strain occur on the opposite side of the sample, i.e. directly below the load application point. For such tests, it is recommended to use samples 8 mm long, 1 mm wide and 4 mm thick. In addition, when testing for bending, other samples can be used, but their dimensions must be selected in such a way that the ratio of the length of the sample to its thickness is 2. applied load test sample (bar) applied load Fig. Principle of bending testing of samples of polymeric materials Fracture Strength (MIT Flex Life Testing Machine) Developed by researchers at the Massachusetts Institute of Technology (MIT), the MIT Flex Test allows technicians to evaluate a material's resistance to fatigue failure (fracture) that can occur under bending loads. The process of fatigue failure of plastics is discussed in much more detail in another book in the same series, Fatigue and Tribological Properties of Plastics and Elastomers. A similar test method is described in ASTM D. This method is the standard method for testing paper for wear resistance (endurance). Such tests are carried out on special testing equipment developed by MIT specialists. Figure shows a diagram of testing on the specified equipment. Figure shows a photograph of the equipment that is used to conduct such tests. One end of the analyzed polymer film sample is fixed in a special clamping device, which very quickly rotates relative to the axis through an angle of 27 and returns to its original position. The second end of the film sample is subjected to a constant tensile load (i.e., is in a stressed state). Although the standard method described by ASTM was developed specifically for testing paper samples, the same method can also be used to test any polymer films. Very often, this method is also used to evaluate polymer materials used as insulation for wires and cables. A similar method can also be used to analyze the effect of tensile load on the durability of film materials. To simulate actual film operating conditions, samples may be exposed to elevated temperatures and/or chemicals before testing.
8 6 2. Basic properties of films obtained from plastics and elastomers, which makes it possible to more accurately predict the resistance of films to destruction during operation under real conditions. The service life under cyclic exposure to bending load is the number of load cycles after which the film sample fails. 6, MPa film sample for testing Fig. Schematic for determining fracture resistance when testing on an MIT bending life testing machine Fig. MIT (Massachusetts Institute of Technology) bending life testing machine (photo courtesy of Testing Machines Inc.)
9 Puncture resistance Puncture resistance, characteristic of films for packaging purposes, is often of particular interest to consumers of shoulder products. There are several standard methods that are used to evaluate the puncture strength of films. High Speed Puncture Test The High Speed Puncture Test is conducted according to the method described in ASTM D, High Speed Puncture Test of Polymer Films Using Load and Displacement Cells. Speed Puncture Properties of Plastic Film Using Load and Displacement Sensors). Figure shows a schematic representation of the fixture used to conduct this test on an Instron Universal Testing Machine. High-speed puncture tests typically use items such as a hydraulic drive(s), an impact element (or stylus), a ring jig, a load clamping device (load cell), a set of regulators, a data acquisition board, and a computer. with the help of which the test system is controlled, the relevant parameters are measured, and the test report is prepared. load sensor impact element (or probe) impact element (or probe) load sensor radius R film film Fig. Schematic representation of a device for conducting high-speed puncture tests. In Fig. Figure 2.2 presents a typical graphical dependence, with the help of which the results of such tests are more clearly displayed, that is, the dependence of the load on the displacement. Such tests are very often carried out at different rates of load on the film sample. The standard also provides recommended speed values that are appropriate for testing at 2.5, 25, 125, 2, and 25 m/min (.137, 1.367, 6.835, 1.936, and 13.67 ft/s, respectively).
INTERSTATE STANDARD CELLULAR RIGID PLASTICS TENSION TEST METHOD IPC PUBLISHING HOUSE OF STANDARDS Moscow INTERSTATE STANDARD CELLULAR RIGID PLASTICS Tensile test method
G O U D A R S T V E N Y S T A N D A R T S O YUZ A S S R PAINT MATERIALS METHOD FOR DETERMINING TENSILE STRENGTH, ELONGATION AT BREAK AND MODULE OF ELASTICITY GOST 1899- 7
Tension (compression) of structural elements. Determination of internal forces, stresses, deformations (longitudinal and transverse). Transverse strain coefficient (Poisson's ratio). Bernoulli's conjecture and
GOST 11262-80 State standard of the USSR PLASTICS TENSILE TEST METHOD GOST 11262-80 (ST SEV 1199-78) Official publication Reissue (November 1986) with Amendment 1, approved in
GOST 9550-81 M E F G O S U D A R S T V E N Y S T A N D A R T PLASTICS METHODS FOR DETERMINING THE MODULE OF ELASTICITY IN TENSILE, COMPRESSION AND BENDING Official publication IPC PUBLISHING HOUSE OF STANDARDS Moscow cost
1 High-molecular compounds (Lysenko E.A.) Lecture 15. Mechanical properties of crystalline polymers. Strength and durability. 2 1. Thermomechanical properties of crystalline and amorphized polymers.
43 MECHANICAL PROPERTIES OF BIOLOGICAL TISSUES. PHYSICAL QUESTIONS OF HEMODYNAMICS Task 1. Choose the correct answer: 1. Deformation is called.... a) a change in the relative position of bodies; b) change in mutual
Work 6 DETERMINATION OF THE MODULE OF LONGITUDINAL ELASTICITY AND POISSON'S RATIO WHEN TESTING A MATERIAL FOR TENSILE Purpose of the work: determination of the elastic characteristics of the material modulus of longitudinal elasticity (modulus
Ticket. What formula is used to determine stresses during central tension and compression? N N,.Which of the Q diagrams corresponds to the given beam? d) Diagrams. What deformation is a given beam subject to? central
G O S U D A R S T V E N Y S T A N D A R T S O YUZ A S S R POLYMER FILMS TENSILE TEST METHOD GOST 14236 81 (ST SEV 1490 79) Official publication STATE COMMITTEE USSR BY STANDARDS
MOSCOW ENERGY INSTITUTE (National Research University) Department of Dynamics and Strength of Machines named after V.V. Bolotin Task 2 Student: Eremin L.I. Group: S-06-09 Teacher: Poznyak
Shear of structural elements Determination of internal forces, stresses and strains during shear The concept of pure shear Hooke's law for shear Specific potential energy of deformation during pure shear Calculations
Lecture 16 Elastic forces. Elastic properties of solids. Hooke's law for various deformations. Elastic moduli, Poisson's ratio. Voltage diagram. Elastic hysteresis. Elastic potential energy
FEDERAL AGENCY FOR TECHNICAL REGULATION AND METROLOGY NATIONAL STANDARD ARTRO RUSSIAN FEDERATION AND GOST REN 1608 -2008 THERMAL INSULATION PRODUCTS APPLIED
HOOKE'S LAW Purpose of the work: to check the applicability of Hooke's law for elastic materials using the example of a spring and a rubber band. Instruments and accessories: computer, installation for testing Hooke's law, set of weights,
78 Elastic forces Hooke’s law All solid bodies, as a result of external mechanical action, change their shape to one degree or another, since under the influence of external forces the location in these bodies changes
MINISTRY OF HIGHER AND SECONDARY SPECIAL EDUCATION OF THE REPUBLIC OF UZBEKISTAN TASHKENT CHEMICAL-TECHNOLOGICAL INSTITUTE Department: “Machines and equipment for the food industry, basic mechanics” ABSTRACT
UDC 621.357:669.715 V. N. Malyshev ASSESSMENT OF STRENGTHENING ALUMINUM ALLOYS BY MICROARC TREATMENT FROM THE RESULTS OF STATIC AND DYNAMIC TESTS Conducted studies of the influence of microarc processing
Examination ticket 1 1. Real object and design diagram. External and internal forces. Section method. Main types of beam loading. 2. The concept of fatigue strength. Examination card 2 1. Stretching
Page from APPROVED General Director of ANO "CISIS FMT" O.N. Shornikova PROTOCOL / R-REC Relax from February. Determination of the tensile characteristics of plastics. Customer LLC "REK" at the address: Moscow, Godovikova St.
(ISO 5628:1990) INTERSTATE STANDARD Paper and cardboard DETERMINATION OF BENDING RIGIDITY BY STATIC METHODS General provisions Official publication Interstate Council for Standardization and Metrology
1. Mechanical properties and mechanical characteristics of materials On the stress diagram, the ultimate strength of the material corresponds to the point ANSWER: 1) B; 2) D; 3) E; 4) A. 2. Maximum stress in the part
Topic 4 Mechanical characteristics of materials. Lecture 4 Basic concepts. Proportional limit, elastic limit, yield strength, tensile strength, tensile strength, true tensile stress,
Ministry of Education and Science of the Russian Federation State educational institution of higher professional education “Moscow State Technical University named after N.E. Bauman"
GOST 15873-70 INTERSTATE STANDARD OF CELLULAR ELASTIC PLASTICS METHOD TENSILE TEST IPC PUBLISHING HOUSE OF STANDARDS Moscow STATE STANDARD OF THE USSR CELLULAR ELASTIC PLASTICS
G O S U D A R S T V E N Y S T A N D A R T S O U Z A S S R WOOD METHOD FOR DETERMINING STRENGTH AT STATIC BENDING GOST 16483.3-84 (ST SEV 390-76) USSR STATE COMMITTEE ON STANDARDS
APPENDIX 1 EXAMPLES OF SOLVING PROBLEMS Problem 1 A stepped steel beam St is loaded as shown in Fig. P.1.1, a. Based on the strength condition, select the cross-sectional dimensions. Construct a displacement diagram
GOST 17370-7 1 M E F G O S D A R S T V E N N Y S T A N D A R T PLASTICS, CELLULAR RIGID METHOD TENSILE TESTING Official publication Moscow Standartinform 2006 technical inspection of buildings
Laboratory work Study of tensile deformation. Purpose: Instruments and equipment: device for studying tensile deformation; dial indicator 0-10 mm; micrometer; measuring ruler; steel
EXPERIMENTAL METHODS IN CONDENSED MATTER RESEARCH MODULE 2. MECHANICAL CHARACTERISTICS OF SOLIDS Lecture 13. Stress-strain curve. Elastic constants, yield and strength limits,
Mohr's strength criterion. A feature of Mohr's strength criterion is that it does not contain any criterion hypotheses, but is entirely based on a generalization of experimental results. Strength condition
Calculations of rods for strength and rigidity 1. A rod with a square cross-section a = 20 cm (see figure) is loaded with force. Modulus of elasticity of the material E=200 GPa. Allowable stress. Allowed movement
UDC 620.178.6 Artyukh G.V. ON THE ISSUE OF DETERMINING POISSON'S RATIO The practice of designing and operating machines for various purposes is characterized by the widespread use of new structural materials
STATE STANDARD OF THE UNION OF THE USSR WOOD METHOD FOR DETERMINING THE STRENGTH LIMIT AT STATIC BENDING GOST 16483.384 (ST SEV 39076) USSR STATE COMMITTEE ON STANDARDS Moscow DEVELOPED by the Ministry
Elec.ru G O S U D A R S T V E N S T A N D A R T YS SOYUZA SASSR ELECTRICAL INSULATING MATERIALS Determination of resistance to ionizing radiation GOST 27604-88 Official publication STATE
State higher educational institution "DONETSK NATIONAL TECHNICAL UNIVERSITY" Department of Physics Laboratory report 0 STUDY OF TENSION DEFORMATION Performed by a group student Teacher
3. STRENGTH OF MATERIALS 3.2. Axial tension-compression. Tension or compression is a type of deformation of a beam (rod) in which only one internal
Strength is it. This is toughness. Stability is 4. Does not apply to assumptions about the properties of the material of structural elements 5. Plate is the ability of a material to resist loads without collapsing
UDC.7:7. RESEARCH OF THE HEAT RESISTANCE OF POLYMER COMPOSITES BASED ON EPOXY MATRIXES V.V. Samoilenko, E.V. Atyasova, A.N. Blaznov, D.E. Zimin, O.S. Tatarintseva, N.N. Khodakova Experimental tests were carried out
V.F. DEMENKO MECHANICS OF MATERIALS AND STRUCTURES 2013 1 LECTURE 10 Experimental study of the mechanical properties of materials in order to assess the strength of engineering structures The main goal is to obtain the limit values for the subject
STATE STANDARD OF THE UNION OF THE SSR MACHINES AND DEVICES FOR DETERMINING THE MECHANICAL PROPERTIES OF MATERIALS TERMS AND DEFINITIONS GOST 14766-69 USSR STATE COMMITTEE FOR PRODUCT QUALITY MANAGEMENT AND
MINISTRY OF EDUCATION OF THE RUSSIAN FEDERATION KAZAN STATE ARCHITECTURAL AND CONSTRUCTION ACADEMY Department of Physics METHODOLOGICAL INSTRUCTIONS FOR LABORATORY WORK IN PHYSICS for students of specialties
METHODOLOGICAL INSTRUCTIONS 1 TOPIC Introduction. Safety briefing. Incoming control. INTRODUCTION TO PRACTICAL LESSONS IN THE APPLIED MECHANICS COURSE. INSTRUCTIONS ON FIRE AND ELECTRICAL SAFETY.
Lecture 8 http://www.supermetalloved.narod.ru Structural strength of materials. Features of deformation of polycrystalline bodies. Hardening, recovery and recrystallization 1. Structural strength of materials
GOST 1579-93 (ISO 7801-84) INTERSTATE STANDARD WIRE METHOD OF BEND TESTING INTERSTATE COUNCIL FOR STANDARDIZATION, METROLOGY AND CERTIFICATION Minsk Preface 1 DEVELOPED by Technical
GOST 4651-82 State standard of the USSR PLASTICS COMPRESSION TEST METHODS GOST 4651-82 (ST SEV 2896-81) Official publication IPC PUBLISHING HOUSE OF STANDARDS Moscow INFORMATION DATA 1. DEVELOPED
The purpose of the discipline is FORMATION OF KNOWLEDGE ON PROBLEMS OF MECHANICS OF STRENGTH AND FRACTURE OF BUILDING COMPOSITE MATERIALS, FAMILIARIZATION WITH THE PRINCIPLES OF MANAGING FRACTURE RESISTANCE FROM STRUCTURAL POSITION
Test questions on strength of materials 1. Basic principles 2. What are the main hypotheses, assumptions and premises that underlie the science of strength of materials? 3. What main problems does it solve?
Lecture 05 Bending Checking the strength of beams Experience shows that when a prismatic rod with a straight axis is loaded with forces and force pairs located in the symmetry plane, bending deformations are observed
ORGANIZATION FOR COOPERATION OF RAILWAYS (OSJD) II edition Developed by experts of the OSJD Commission on Infrastructure and Rolling Stock August 27 29, 2013, Hungary, Budapest Approved by the meeting
UNIVERSAL HYDRAULIC MACHINES SL SERIES TENSION COMPRESSION BENDING THE FIRST NAME IN MATERIALS TESTING SL SERIES Servo-hydraulic testing machines for physical and mechanical testing of materials with
FEDERAL EDUCATION AGENCY State educational institution of higher professional education TOMSK POLYTECHNIC UNIVERSITY APPROVED by Dean of the ENMF Yu.I. Tyurin 2007 DEFINITION
Calculation of elements of steel structures. Plan. 1. Calculation of elements of metal structures based on limit states. 2. Standard and design resistances of steel 3. Calculation of elements of metal structures
Federal Agency for Education State educational institution of higher professional education "UFA STATE PETROLEUM TECHNICAL UNIVERSITY" Department of Physics ELASTIC
Final test, Applied Mechanics (Sopromat) (2579) 9. (70c.) The strength of a structural element means 1) resistance 2) to external influences 3) up to 4) the occurrence of large deformations 5)
Page 1 of 15 Certification testing in the field of vocational education Specialty: 170105.65 Fuses and control systems for weapons Discipline: Mechanics (Strength of materials)
FEDERAL AGENCY FOR TECHNICAL REGULATION AND METROLOGY NATIONAL STANDARD OF THE RUSSIAN FEDERATION GOST REN 1608-2008 THERMAL INSULATION PRODUCTS USED IN CONSTRUCTION Determination method
Topic 2 Basic concepts. Lecture 2 2.1 Strength of materials as a scientific discipline. 2.2 Schematics of structural elements and external loads. 2.3 Assumptions about the material properties of structural elements.
FEDERAL AGENCY FOR TECHNICAL REGULATION AND METROLOGY NATIONAL STANDARD OF THE RUSSIAN FEDERATION GOST R ISO 9585-2009 IMPLANTS FOR SURGERY Determination of strength and bending rigidity of metal
Torsion of rods with a circular cross section. Internal torsional forces, stresses and deformations. Stress state and torsional failure. Calculation of strength and rigidity of a round shaft
TESTS ON STRENGTH OF MATERIALS BASIC PROVISIONS, METHOD OF SECTIONS, STRESSES Option 1.1 1. A straight beam is loaded with an external force F. After removing the load, its shape and dimensions are completely restored.
Problem 1 We consider two load cases of a flat frame consisting of rod elements of square cross-section. When loaded with distributed loads q and 2q at point k indicated in the figure
News of the Chelyabinsk Scientific Center, vol. 2 (11), 2001 MECHANICS OF DEFORMABLE SOLID BODY UDC 539.3 INFLUENCE OF RADIUS OF ROUND OF SUPPORTS ON THE ACCURACY OF DETERMINING THE INTERLAYER SHEAR MODULE OF REINFORCED
Elastic materials for system solutions sylomer Description of the special elastomer Sylomer is a special polyurethane elastomer produced by Getzner Werkstoffe GmbH (Austria) in molded or foamed form
Test methods for polymer materials
Mechanical tests. Hardness tests. Impact strength tests. Thermal tests. Electrical tests. Optical tests. Physical tests. Rheological tests. Flammability tests.
Mechanical tests
1. Strength, deformation and tensile modulus ISO R527 (DIN 53455, DIN 53457, ASTM D638M)
The basis for understanding the properties of a material is information about how the material reacts to any load. By knowing the amount of deformation produced by a given load (stress), the designer can predict the response of a particular product to its operating conditions. Tensile stress-strain relationships are the most widely published mechanical properties for comparing materials or designing specific products.
Laboratory installation for mechanical testing
Test speeds:
Speed A - 1 mm/min - tensile modulus.
Speed B - 5 mm/min - tensile stress diagram for glass fiber filled resins.
Speed C - 50 mm/min - tensile stress diagram for unfilled resins.
Tensile stress-strain relationships are determined as follows. The double blade shaped sample is stretched at a constant rate and the applied load and elongation are recorded. After this, stresses and strains are calculated:

ISO R527 Universal Test Sample

Voltage diagram
A: Limit of proportionality.
B: Yield strength.
C: Tensile strength.
X: Destruction.
0-A: Yield strength region, elastic properties.
After A: Plastic properties.
2. Strength and flexural modulus ISO 178 (DIN 53452, ASTM D790)

Modern bend testing machine: "Flexometer"
Flexural strength is a measure of how well a material resists bending, or "how stiff the material is." Unlike tensile loading, in bending testing all forces act in the same direction. An ordinary, simply supported rod is loaded in the middle of the span: thereby creating a three-point load. On a standard testing machine, the loading tip presses onto the sample at a constant speed of 2 mm/min.
To calculate the flexural modulus of elasticity, a curve of deflection versus load is constructed from the recorded data. Starting from the initial linear part of the curve, use a minimum of five load and deflection values.
Flexural modulus (the ratio of stress to strain) is most often mentioned when referring to elastic properties. The flexural modulus of elasticity is equivalent to the slope of the tangent line to the stress/strain curve in that part of the curve where the plastic has not yet deformed.
The values of stress and modulus of elasticity in bending are measured in MPa.

Bending tests
3. Wear test on Taber machine ISO 3537 (DIN 52347, ASTM D1044) 
Wear tests on a Taber machine
These tests measure the amount of abrasion loss by abrading the sample using a Taber machine. The sample is fixed on a disk rotating at a frequency of 60 rpm. The forces created by the weights press the abrasive wheels against the sample. After a specified number of cycles, the tests are stopped. The mass of abrasion loss is defined as the mass of particles that were removed from the sample: this mass is expressed in mg/1000 cycles. Abrasive wheels are actually sharpening stones in the shape of a circle. Various types of these circles are used.
4. Comparison of ISO (International Organization for Standardization) and ASTM (American Society for Testing and Materials) methods.
Application of the ISO method not only changes the test conditions and test mandrel dimensions (compared to the ASTM method), but also requires standardized mold designs and molding conditions in accordance with ISO 294. This may result in differences in published values - not due to a change in the properties of the material, but due to a change in the test method. According to the ASTM method, the test specimen has a thickness of 3 mm, while the ISO has selected specimens with a thickness of 4 mm.
Hardness tests
1. Comparison of hardness according to Brinell, Rockwell and Shore

Hardness scale ratio
The Rockwell test determines the hardness of plastics after elastic recovery of the specimen's deformation during testing. This differs from the Brinell and Shore hardness tests: in these tests, hardness is determined by the depth of penetration under load and, therefore, excludes any elastic recovery of deformation of the material. Therefore, Rockwell values cannot be directly correlated with Brinell or Shore hardness values.
The Shore A and D hardness ranges can be compared with the Brinell hardness ranges. However, there is no linear correlation.
2. Brinell hardness ISO 2039-1 (DIN 53456) 
Determination of Brinell hardness
A polished hardened steel ball with a diameter of 5 mm is pressed into the surface of the test sample (at least 4 mm thick) with a force of 358 N. 30 s after application of the load, the depth of the indentation is measured. Brinell hardness H 358/30 is calculated as the “applied load” divided by the “imprint surface area”.
The result is expressed in N/mm2.
3. Rockwell hardness ISO 2039-2 
Rockwell hardness determination
The Rockwell hardness number directly relates to the hardness of the imprint on the plastic: the higher the number, the harder the material. Due to the slight overlap of Rockwell hardness scales for the same material, it is possible to obtain two different numbers on two different scales, both of which may be technically correct.
The indenter, which is a polished hardened steel ball, is pressed into the surface of the test sample. The diameter of the ball depends on the Rockwell scale used. The sample is loaded with a “minor load”, then with a “main load”, and then again with the same “minor load”. The actual measurement is based on the total penetration depth, this depth is calculated as the total depth after the main load is removed minus the elastic recovery after the main load is removed and minus the penetration depth at light load. The Rockwell hardness number is calculated as "130 minus the penetration depth in units of 0.002 mm."


Portable Rockwell Hardness Tester Laboratory Rockwell Hardness Tester
Rockwell hardness numbers should be between 50 and 115. Values outside these limits are considered inaccurate: the measurement must be repeated again using the next harder scale. The scales increase in hardness from R through L to M (with increasing hardness of the material). The loads and diameters of the indenters are indicated in more detail in the table.
| Hardness scale | Rockwell indenter ball diameter, mm | ||
| R | 98,07 | 588,4 | 12,7 |
| L | 98,07 | 588,4 | 6,35 |
| M | 98,07 | 980,7 | 6,35 |
If a softer material requires a scale less severe than the R scale, then the Rockwell hardness test is not appropriate. Then you can use the Shore hardness method (ISO 868), which is used for low-modulus materials.
4. Shore hardness ISO 868 (DIN 53505, ASTM D2240) 
Shore hardness determination
Shore hardness values are the scale readings obtained when a specific steel rod penetrates the plastic. This hardness is determined by two types of scleroscopes, both of which have calibrated springs to apply a load to the indenter. Scleroscope A is used for softer materials, and scleroscope D is used for harder materials. 
Indenters for scleroscopes
Shore hardness values vary:
from 10 to 90 for Shore type A scleroscope - soft materials,
from 20 to 90 for Shore type D scleroscope - hard materials.
If the measured values are >90A, the material is too hard and a scleroscope D must be used.
If the measured values<20D, то материал слишком мягок, и должен применяться склероскоп А.
There is no simple relationship between the hardness measured by this test method and other fundamental properties of the material being tested.
Impact tests
1. The concept of impact strength
In standard tests, such as tensile and bending tests, the material absorbs energy slowly. In reality, materials very often quickly absorb the energy of an applied force, for example, forces from falling objects, impacts, collisions, falls, etc. The purpose of impact testing is to simulate such conditions.
The Izod and Charpy methods are used to study the properties of certain samples under given impact stresses and to evaluate the brittleness or toughness of the samples. Test results from these methods should not be used as a source of data for component design calculations. Information about typical material properties can be obtained by testing different types of test specimens prepared under different conditions, varying the notch radius and test temperature.
Tests using both methods are carried out on a pendulum impact driver. The sample is clamped in a vice, and a pendulum impact driver with a hardened steel impact surface of a certain radius is released from a given height, which causes the sample to shear under a sudden load. The residual energy of the pendulum pile driver lifts it upward. The difference between the fall height and the return height determines the energy expended on the destruction of the test sample. These tests can be carried out at room temperature or at reduced temperatures to determine cold brittleness. The test samples may differ in the type and size of cuts.
The results of drop weight impact tests, such as the Gardner method or curved plate test, depend on the geometry of the drop weight and the support. They can only be used to determine the relative ranking of materials. Impact test results cannot be considered absolute unless the geometry of the test equipment and specimen meets the requirements of the end application. It can be expected that the relative ranking of materials according to the two test methods will be the same if the nature of destruction and impact velocities are the same.
2. Interpretation of Impact Test Results - Comparison of ISO and ASTM Methods
Impact characteristics can be highly dependent on sample thickness and molecular orientation. The different specimen thicknesses used in the ISO and ASTM methods can have a very significant effect on the impact strength values. Changing the thickness from 3 mm to 4 mm can even result in a change in failure mode from ductile to brittle due to the influence of molecular weight and thickness of the notched specimen using the Izod method, as demonstrated for polycarbonate resins. Materials that already show a brittle fracture pattern at a thickness of 3 mm, for example, materials with mineral and fiberglass fillers, are not affected by changing the thickness of the sample. Materials with modifying additives that increase impact strength have the same properties. 
Influence of thickness and molecular weight of a notched sample on the results of Izod impact tests of polycarbonate resins
It is necessary to clearly understand that:
It is not the materials that have changed, only the test methods;
The mentioned transition from ductile to brittle fracture plays an insignificant role in reality: the vast majority of designed products have a thickness of 3 mm or less.
3. Impact strength according to Izod ISO 180 (ASTM D256) 
Laboratory instrument for measuring Izod impact strength
Izod impact testing of notched specimens has become a standard method for comparing the impact strength of plastics. However, the results of this test method do not closely correspond to the impact response of the molded product in a real-world environment. Due to the different notch sensitivities of materials, this test method may allow some materials to be rejected. Although the results of these tests are often requested as meaningful measures of impact resistance, these tests tend to measure the notch sensitivity of the material rather than the ability of the plastic to withstand impact.
The results of these tests are widely used as a reference for comparing the impact strengths of materials. Izod impact testing of notched specimens is best suited for determining the impact strength of products that have many sharp corners, such as ribs, intersecting walls, and other stress concentration areas. When testing Izod impact strength of unnotched specimens, the same loading geometry is used, except that the specimen is unnotched (or is clamped in a vice in an inverted position). This type of test always gives better results than Izod notched tests due to the absence of stress concentration points.
The impact strength of notched samples using the Izod method is the impact energy expended to destroy the notched sample, divided by the original cross-sectional area of the sample at the notch site. This strength is expressed in kilojoules per square meter: kJ/m2. The sample is clamped vertically in the vise of an impact driver.
ISO designations reflect the type of specimen and the type of cut:
ISO 180/1A designates specimen type 1 and notch type A. As can be seen in the figure below, specimen type 1 is 80mm long, 10mm high and 4mm thick.
ISO 180/1O represents the same sample 1 but clamped in an inverted position (reported as "uncut").
The ASTM specimens have similar dimensions: the same radius at the base of the notch and the same height, but differ in length - 63.5 mm and, more importantly, in thickness - 3.2 mm.
ISO test results are determined as the impact energy in joules expended to fracture the test specimen divided by the cross-sectional area of the specimen at the notch location. The result is expressed in logjoules per square meter: kJ/m2.
ASTM test results are determined as the impact energy in joules divided by the notch length (i.e., specimen thickness). They are expressed in joules per meter: J/m. The practical conversion factor is 10: i.e. 100 J/m is equal to approximately 10 kJ/m2.
Different sample thicknesses may result in different interpretations of “toughness,” as shown separately.

Samples for impact strength measurements 
Izod impact strength measurement method
4. Impact strength according to Charpy ISO 179 (ASTM D256) 
Charpy strength measuring device
The main difference between the Charpy and Izod methods is the method of installing the test sample. When testing using the Charpy method, the sample is not clamped, but is freely placed on a support in a horizontal position.
ISO designations reflect the type of specimen and the type of cut:
ISO 179/1C designates specimen type 2 and notch type CI;
ISO 179/2D designates specimen type 2, but uncut.

Charpy impact strength measurement method
The samples used according to the DIN 53453 method have similar dimensions. The results for both the ISO and DIN methods are defined as the impact energy in joules absorbed by the test specimen divided by the cross-sectional area of the specimen at the notch location. These results are expressed in kilojoules per square meter: kJ/m2.
Thermal tests
1. Heat resistance according to Vicat ISO 306 (DIN 53460, ASTM D1525) 
Laboratory Vicat heat resistance tester
These tests provide the temperature at which the plastic begins to rapidly soften. A round, flat-ended needle having a cross-sectional area of 1 mm² is inserted into the surface of a plastic test piece under a specified load and the temperature is increased at a uniform rate. Vicat heat resistance (VST - Vicat softening point) is the temperature at which penetration reaches 1 mm. 
Determination of heat resistance according to Vicat
ISO 306 standard describes two methods:
Method A - load 10 N;
Method B - load 50 N.
...with two possible rates of temperature rise:
50 °C/hour;
120 °C/hour.
ISO test results are reported as A50, A120, B50 or B120. The test assembly is immersed in a heating bath with an initial temperature of 23 °C. After 5 minutes, a load of 10 or 50 N is applied. The bath temperature at which the indenter tip is embedded to a depth of 1 + 0.01 mm is recorded as the Vicat heat resistance of the material at the selected load and rate of temperature increase.
2. Interpretation of thermal characteristics comparison of ISO and ASTM methods
Some differences may be found in published results using the ISO method compared to ASTM standards due to the different sizes of the test specimens: thermal strain resistance values measured using ISO methods may be lower.
3. Deformation heat resistance and deformation heat resistance under load ISO 75 (DIN 53461, ASTM D648)
Deformation heat resistance is a relative measure of a material's ability to withstand stress for a short period of time at elevated temperatures. These tests measure the effect of temperature on stiffness by applying specific surface stresses to a standard test piece and increasing the temperature at a uniform rate.
The samples used in the tests are either annealed or unannealed. Tempering is a process in which a sample is heated to a certain temperature, held at that temperature for a period of time, and then gradually lowered to ambient temperature. Such actions make it possible to reduce or completely remove internal stresses in the sample body that arose, for example, during accelerated polymerization in an injection molding machine.
In both ISO and ASTM standards, the loaded test specimen is immersed in a heating bath filled with silicone oil.
The surface stresses of the sample are:
Low - for ISO and ASTM methods - 0.45 MPa;
High - for the ISO method - 1.80 MPa, and for the ASTM method - 1.82 MPa.
The force is allowed to apply for 5 minutes, but this holding period may be omitted if the test materials do not exhibit appreciable creep during the first 5 minutes. After 5 minutes, the initial bath temperature of 23 °C is increased at a uniform rate of 2 °C/min.
The deformation of the test sample is continuously monitored:
the temperature at which deflection reaches 0.32 mm (ISO) and 0.25 mm (ASTM) is recorded as the “strain heat resistance under load” or simply “strain heat resistance” (thermal deformation temperature).
Although not mentioned in either test standard, two abbreviations are commonly used:
DTUL - Deformation heat resistance under load
HDT - Deformation heat resistance or bending heat resistance

Determination of deformation heat resistance
In general practice, the abbreviation DTIL is used for results obtained by the ASTM method, and the abbreviation HDT is used for results obtained by the ISO method.
Depending on the surface stress created, the letters A or B are added to the abbreviation HDT:
HDT/A for load 1.80 MPa
HDT/B for load 0.45 MPa
4. Deformation heat resistance (HDT) and amorphous and semi-crystalline plastics
For amorphous polymers, HDT values approximately coincide with the glass transition temperature Tg of the material.
Since amorphous polymers do not have a specific melting point, they are processed in their highly elastic state at temperatures above the Tg.
Crystalline polymers can have low HDT values and still have structural utility at higher temperatures: the HDT determination method is more reproducible with amorphous plastics than with crystalline ones. Some polymers may require tempering (annealing) of test samples to obtain reliable results.
When glass fibers are added to a polymer, its modulus increases. Since HDT is the temperature at which a material has a certain modulus, increasing the modulus also increases the HDT value. Glass fiber has a greater effect on the HDT of crystalline polymers compared to amorphous polymers.
Although widely used to indicate high temperature performance, HDT testing simulates only a narrow range of conditions. In many high temperature applications, products operate at higher temperatures, higher loads and without supports. Therefore, the results obtained with this test method do not represent the maximum application temperature, since in actual practice, significant factors such as time, load and surface stress ratings may differ from the test conditions.
5. Pressing in the ball EC335-1
These are heat resistance tests similar to the Vicat test. The sample is placed horizontally on a support in the heating chamber and a ball with a diameter of 5 mm is pressed into it with a force of 20 N. After one hour, the ball is removed, the sample is cooled in water for 10 seconds and the imprint left by the ball is measured. If the indentation diameter is less than 2 mm, then the material is considered to have passed the ball indentation test at that temperature. 
Ball indentation test
Depending on the application, the test temperature may vary:
75 °C for non-live parts,
125 °C for live parts.
6. Thermal Conductivity ASTM C 177
The thermal insulation properties of plastics are determined by measuring thermal conductivity. Wide plastic plates are installed on both sides of a small heated plate, and heat sinks are attached to the free surfaces of the plates. Thermal insulators located around the test chamber prevent radial heat loss. The axial heat flow through the plastic plates can then be measured. The results are recorded in W/m°C.
7. Relative Thermal Conductivity Index, RTI UL 746B
Formerly referred to as the Continuous Use Temperature (CUTR), the relative temperature index (RTI) is the maximum service temperature at which all critical properties of a material remain within acceptable limits over an extended period of time.
According to the UL 746B standard, one material can be assigned three independent RTI indexes:
Electrical - by measuring the dielectric strength of the dielectric.
Impact mechanical - by measuring tensile impact strength.
Unstressed mechanical - by measuring tensile strength.
These three properties were selected as critical in the tests due to their sensitivity to high temperatures during use.
The thermal performance of the material is tested over a long period of time in comparison with a second control material for which the RTI index has already been determined and which has shown good performance.
Based on the term "relative temperature index", the control material is used because the characteristics that deteriorate with increasing temperature are inherently sensitive to the variables of the test program itself. The control material is affected by the same specific combinations of these factors during testing, providing a valid basis for comparison with the test material.
Ideally, long-term thermal performance could be assessed by aging the test material at normal temperature for an extended period of time. However, this is not practical for most applications. Therefore, accelerated aging occurs at significantly higher temperatures. During the aging process, samples of the test and control materials are placed in ovens in which a given constant temperature is maintained. Samples of the test and control materials are removed at specified times and then tested to ensure that their basic properties are retained. By measuring the three mentioned properties as a function of time and temperature, the "end of life" for each temperature can be mathematically calculated. This “end of life” is defined as the time during which the properties of a material have deteriorated by 50% compared to its original properties. By substituting the test data into the Arrhenius equation, the maximum temperature at which the test material will have a satisfactory service life can be determined. This calculated temperature is the RTI index for each material property.
Understanding the methodology for determining the RTI index allows the designer to use this index to predict how parts formed from a given material will perform in actual service at elevated temperatures.
8. Coefficient of linear thermal expansion ASTM D696, DIN 53752
Every material expands when heated. Injection molded polymer parts expand and change size as the temperature increases. To estimate this expansion, designers use the coefficient of linear thermal expansion (CLTE), which measures changes in the length, width, and thickness of the molded part. Amorphous polymers generally exhibit consistent expansion rates across their practical temperature range. Crystalline polymers generally exhibit increased expansion rates at temperatures above their glass transition temperature.
The addition of fillers that create anisotropy significantly affects the CLTE coefficient of the polymer. Glass fibers are usually oriented in the direction of the flow front: when the polymer is heated, the fibers prevent expansion along their axis and reduce the CLTE coefficient. In directions perpendicular to the flow direction and thickness, the CLTE coefficient will be higher.
Polymers can be formulated to have a CLTE value that matches the thermal expansion coefficients of metals or other materials used in composite structures, such as automotive parts.
Electrical tests
1. Dielectric strength IEC 243-1 
Laboratory installation for measuring electrical strength
Dielectric strength reflects the electrical strength of insulating materials at different power supply frequencies (from 48 Hz to 62 Hz) or is a measure of the resistance to breakdown of a dielectric material under applied voltage. The applied voltage immediately before breakdown is divided by the sample thickness to obtain a result in kV/mm.
The environment can be air or oil. The dependence on thickness can be significant, and therefore all results are recorded at a given sample thickness.
Many factors influence the results:
Thickness, uniformity and moisture content of the test sample;
Dimensions and thermal conductivity of test electrodes;
Frequency and waveform of applied voltage;
Ambient temperature, pressure and humidity;
Electrical and thermal characteristics of the environment.
2. Surface resistivity IEC 93 (ASTM D257)
When insulating plastic is energized, a portion of the total current will flow along the surface of the plastic if there is another conductor or ground wire connected to the product. Surface resistivity is a measure of the ability to resist this surface current.
It is measured as resistance when a direct current flows between electrodes mounted on a surface of unit width with a unit distance between them. This resistance is measured in Ohms, sometimes called "Ohms per square".
3. Volume resistivity IEC 93 (ASTM D257)
When an electrical potential is applied across an insulator, current flow will be limited by the resistance properties of the material. Volume resistivity is the electrical resistance when an electrical voltage is applied to opposite faces of a unit cube.
Measured in Ohm*cm. Volume resistivity is influenced by the environmental conditions acting on the material. It changes inversely to temperature and decreases slightly in humid environments. Materials with a volume resistivity greater than 108 Ohm*cm are considered insulators. Partial conductors have volume resistivity values from 103 to 108 Ohm*cm.
4. Relative dielectric constant IEC 250
As stated in the IEC 250 standard, "the relative dielectric constant of an insulating material is the ratio of the capacitance of a capacitor in which the space between and around the electrodes is filled with insulating material to the capacitance of a capacitor with the same electrode configuration in a vacuum."
In AC dielectric applications, the required characteristics are good resistivity and low energy dissipation. Electrical dissipation causes electronic components to function inefficiently and causes the temperature of the plastic part, which serves as a dielectric, to rise. In an ideal dielectric, for example in a vacuum, there are no energy losses due to the dipole movement of molecules. In solid materials, such as plastics, dipole movement becomes one of the influencing factors. A measure of this inefficiency is the relative dielectric constant (formerly called the dielectric constant).
This is a dimensionless coefficient obtained by dividing the parallel capacitance of a system with a plastic dielectric element by the capacitance of a system with a vacuum as a dielectric. The lower this number, the better the material's performance as an insulator.
5. Dissipation coefficient IEC 250
As stated in the IEC 250 standard, "the dielectric loss angle of an insulating material is the angle by which the phase difference between the applied voltage and the received current deviates from Pi/2 radians when the dielectric of the capacitor consists solely of the dielectric material under test. Dissipation factor tg d of the dielectric of the insulating material is the loss tangent d".
In an ideal dielectric, the voltage and current curves are exactly 90° out of phase. When the dielectric becomes less than 100% efficient, the current waveform begins to lag behind the voltage in direct proportion. The amount of current wave that deviates from being 90° out of phase with the voltage is defined as the "dielectric loss angle". The tangent of this angle is called the "loss tangent" or "dissipation factor".
A low dissipation factor is very important for plastic insulators in high frequency applications, such as radar equipment and parts operating in microwave environments: lower values correspond to better dielectric materials. A high dissipation factor is essential for welding performance.
The relative dielectric constant and dissipation coefficient are measured on the same test equipment. The test results obtained are highly dependent on temperature, moisture content, frequency and voltage.
6. Arc resistance ASTM D495
In cases where electrical current is allowed to pass through the surface of an insulator, the surface becomes damaged after a period of time and becomes conductive.
Arc Resistance is the amount of time in seconds required for an insulating surface to become conductive under a high voltage, low amperage arc. Alternatively, arc resistance refers to the amount of time a plastic surface can resist forming a continuous conductive path when exposed to high voltage with a low amperage arc under specific conditions.
7. Comparative tracking index (Comparative breakdown index) IEC 112
The tracking index represents the relative resistance of electrical insulating materials to form a conductive path when an electrostatically charged surface is exposed to aqueous contaminants. Comparative Tracking Index (CTI) determinations and CTI-M tests are performed to evaluate the safety of components that contain live parts: the insulating material between live parts must be resistant to dielectric tracking. The CTI is defined as the maximum voltage at which insulation failure does not occur after exposure to 50 drops of an aqueous ammonium chloride solution. High CTI values are desirable. Materials that meet the CTI requirements at 600 V are called “high tracking” resins.
The test procedure for determining the CTI index is complex. Influencing factors are the state of the electrodes, electrolyte and sample surface, as well as the applied voltage.
Results may be reduced by adding additives, such as:
Pigments, in particular carbon black,
Antipirinov,
Fiberglass.
Therefore, it is generally not recommended to use materials containing pyrine retardants, carbon black and glass fibers where dielectric tracking resistance is a primary requirement.
Minerals (TiO2) tend to increase CTI values.
8.CTI tests
CTI tests are carried out using two platinum electrodes with specified dimensions, resting evenly with slightly rounded “chisel” edges on the test sample.
The minimum voltage applied to the electrodes is usually 175 V. If the parts are under high electrostatic voltage, then the potential difference is set to 250 V. The voltage is applied in stages of 25 V: the maximum voltage is 600 V.
The surface of the test material is moistened with 50 drops of a 0.1% solution of ammonium chloride in distilled water (so-called solution A), falling centrally between the two electrodes. The size and frequency of falling electrolyte drops are regulated. If there is no current at the selected voltage, the test is repeated with a voltage increased by 25 V until current appears. This voltage, reduced by one step of 25 V, is called the CTI index. The test is then repeated with a voltage 25 V below the CTI voltage, but with 100 drops of electrolyte instead of 50. Determine the voltage at which 100 drops do not produce a current. This value can be reported in parentheses () in addition to the CTI value when exposed to 50 drops of electrolyte.

CTI test
9. CTI-M tests
The CTI-M test is similar to the CTI test, except that it uses a more aggressive wetting agent (M is an abbreviation of the French word "mouille" - "moistened"). Solution B contains 0.1% ammonium chloride and 0.5% alkyl naphthalene sulfonate. Holes created by erosion can also be measured and their depth recorded.
Registration example: CTI 375 (300) M-0.8 means:
50 drops of solution B do not create a current at a voltage of 375 V.
100 drops do not create a current at a voltage of 300 V.
The depth of erosion holes in the surface of the sample can be 0.8 mm.
In accordance with the UL94 standard, a set of tests have been developed to classify the safety of materials used for components of electrical devices for the resistance of the polymer to electric current and fire.
Based on the results of these tests, materials are divided into PLC categories (Performance Level Categories):
Comparative Tracking Index
Arc resistance, D495
High Voltage Arc Rating (HVTR)
Hot wire flammability (HWI) test
High Arc Ignition (HAI)
NA - Number of discharges before ignition Category PLC
120 <= NA 0
60 <= NA < 120 1
30 <= NA < 60 2
15 <= NA < 30 3
0 <= NA < 15 4
Optical testing
1. Turbidity and light transmittance ASTM D1003
Haze is caused by light scattering in the material and may be due to the influence of molecular structure, degree of crystallization, or foreign inclusions on the surface or within the polymer sample. Haze is only characteristic of translucent or transparent materials and does not apply to opaque materials. Haze is sometimes considered the opposite of gloss, which itself can be the absorption of an incident beam of light. However, the haze test method actually measures the absorption, transmission, and deflection of a beam of light by a translucent material.
The sample is placed in the path of a narrow beam of light such that part of the light passes through the sample and the other part is unobstructed. Both parts of the beam pass into a sphere equipped with a photodetector.
Two quantities can be defined:
The overall intensity of the light beam;
The amount of light deviated by more than 2.5° from the original beam.
From these two quantities the following two values can be calculated:
Turbidity, or the percentage of the supply light scattered by more than 2.5°,
Light transmittance, or the percentage of incident light that is transmitted through a sample.
2. Gloss DIN 67530, ASTM D523
Gloss is related to the ability of a surface to reflect more light in a certain direction compared to other directions. Gloss can be measured using a gloss meter. Bright light is reflected from the sample at an angle, and the brightness of the reflected light is measured by a photodetector. The most commonly used angle is 60°. Shinier materials can be measured at an angle of 20°, while matte surfaces can be measured at an angle of 85°. The gloss meter is calibrated using a black glass standard having a gloss value of 100.
Plastics have smaller values - they strictly depend on the molding method.

Gloss measurement method
3. Haze and gloss
Haze and gloss test methods measure how well a material reflects or transmits light. These methods quantify a material classification, such as “transparent” or “shiny.” While haze is limited to transparent or translucent materials, gloss can be measured for any material. Both haze and gloss tests are accurate. But they are often used to evaluate appearance, which is more subjective. The correlation between haze and gloss values, as well as how people rate the "clarity" or "shine" of plastics, is uncertain.
4. Refractive index DIN 53491, ASTM D542 
Determination of refractive index
A beam of light is passed through a transparent sample at a certain angle. The beam deflection caused by the material as the beam passes through the sample is the refractive index, which is determined by dividing sin a by sin b.
Physical tests
1. Density ISO 1183 (DIN 53479, ASTM D792)
Density is the mass divided by unit volume of a material at 23°C and is usually expressed in grams per cubic centimeter (g/cm3) or grams per milliliter (g/ml). "Specific gravity" is the ratio of the mass of a given volume of material to the mass of the same volume of water at a specified temperature.
Density can be measured by several methods, as described in the ISO 1183 standard:
Method of dipping plastics in a finished state.
Pycnometric method for plastics in the form of powders, granules, tablets or molded products reduced to small particles.
Titration method for plastics of similar shapes to those required for Method A.
Density gradient column method for plastics similar to those required for Method A.
Gradient density columns are columns of liquid whose density increases uniformly from top to bottom. They are especially suitable for measuring the density of small samples of products and for comparing densities.
2. Water absorption ISO 62 (ASTM D570)
Plastics absorb water. Moisture content can cause changes in dimensions or properties such as electrical insulation resistance, dielectric loss, mechanical strength and appearance.
Determination of the water absorption of a plastic sample of certain sizes is carried out by immersing the sample in water for a specified period of time and at a specified temperature. Measurement results are expressed either in milligrams of water absorbed or as a percentage increase in mass. It is only possible to compare the water absorption of different plastics when the test samples are identical in size and in the same physical condition.
Test samples are pre-dried at 50°C for 24 hours, cooled to room temperature and weighed before being immersed in water at a given temperature for a given period of time.
Water absorption can be measured:
Samples are placed in a vessel with distilled water at a temperature of 23° C.
After 24 hours, the samples are dried and weighed.
The samples are placed in boiling water for 30 minutes, cooled for 15 minutes in water at a temperature of 23°C and weighed again.
Until saturation
The samples are immersed in water at a temperature of 23°C until they are completely saturated with water.
Water absorption can be expressed as:
The mass of absorbed water,
Mass of absorbed water per unit surface area,
The percentage of water absorbed relative to the weight of the test sample.
Rheological tests
1. Molding shrinkage ISO 2577 (ASTM D955)
Molding shrinkage is the difference between the dimensions of the mold and the molded part produced in that mold. It is recorded in % or millimeters per millimeter.
Forming shrinkage values are recorded both parallel to the material flow ("in the flow direction") and perpendicular to the flow ("in the cross-flow direction"). For fiberglass materials these values can vary significantly. Molding shrinkage can also be affected by other parameters, such as part design, mold design, mold temperature, injection specific pressure, and molding cycle time.
Forming shrinkage values (when measured on simple parts such as a tensile test piece or disk) are only typical data for material selection. They cannot be applied to part or tool designs.
2. Melt Flow Rate/Melt Index ISO 1133 (DIN 53735, ASTM D 1238)
Melt flow rate (MFR) or melt index (MFI) tests measure the flow of molten polymer through an extrusion plastometer under specified temperature and load conditions. The extrusion plastometer consists of a vertical cylinder with a small head of 2 mm diameter at the bottom and a removable piston at the top. A charge of material is placed in a cylinder and preheated for several minutes. A piston is placed on the top surface of the molten polymer and its weight forces the polymer through the head onto the collection plate. The test time period varies from 15 s to 6 min depending on the viscosity of the plastics. Temperature values used: 220, 250 and 300°C. The masses of the applied loads are 1.2, 5 and 10 kg.
The amount of polymer collected after a given test period is weighed and converted into the number of grams that could be extruded after 10 minutes. The melt flow rate is expressed in grams per reference time.
Example: MFR (220/10) = xx g/10 min - means the melt flow rate at a test temperature of 220°C and a rated load mass of 10 kg.

Melt index measurement method
The flow rate of the polymer melt depends on the shear rate. The shear rates used in these tests are significantly lower than those used under normal manufacturing conditions. Therefore, the data obtained by this method may not always correspond to its properties in actual use.
3. Melt Volume Flow/Melt Volume Index ISO 1133 (DIN 53735, ASTM D 1238)
The DIN 53735 standard describes three flow measurement methods:
"Verfahren A"
"Verfahren B", which in turn includes two methods:
The Verfahren A method involves measuring the mass as plastic is extruded through a given die.
The Verfahren B method consists of measuring piston displacement and material density under similar conditions.
Using the Verfahren B/Mebprinzip 1 method, the distance over which the piston moves is measured.
The Verfahren B/Mebprinzip 2 method measures the time during which the piston moves.
To summarize these methods, the flow index according to Verfahren A according to DIN 53735 is equal to the flow rate MFR according to ISO 1133.
At the top of the description of these different methods, DIN 53735 describes the volumetric flow index (MVI). (ISO 1133 does not mention MVI.)
The MVI index is defined as the volume of plastic that is extruded through the head within a given time.
The MFI index is defined as the mass of plastic extruded through the head for a given time. The MVI index is expressed in cm³/10 min, and the MFI index in g/10 min.
The temperatures used are 220, 250, 260, 265, 280, 300, 320 and 360°C. Weight of used loads - 1.2; 2.16; 3.8; 5; 10 and 21 kg.
Example: MVI (250/5) means the volumetric flow index in cm³/10 min for a test temperature of 250°C and a nominal load mass of 5 kg.
4. Melt viscosity DIN 54811
The properties of the melt are determined in a capillary viscometer. Either the pressure is measured at a given volumetric flow rate and a given temperature, or the volumetric flow rate at a given pressure. Melt viscosity (MV) is the ratio of the actual shear stress t and the actual shear stress f. It is expressed in Pa*s.
5. Practical application of MV, MFR/MFI, MVI characteristics in production
The MV method with capillary viscometer measurement is very similar to the normal extrusion process. As such, the MV method is a good basis for comparing the flow of injection molded materials: it represents the viscosity as the melt passes through the nozzle. MFR/MFI and MVI methods, where the shear rate is too low, are not suitable for use in the injection molding process. They are a good reference for manufacturer and processor control, easily, quickly and inexpensively, but are not suitable for selecting a material for its expected molding flow.
Flammability tests
1. General information about flammability according to UL94 standard
The most widely accepted standards for flammability characteristics are the UL94 (Underwriters Research Laboratories) category standards for plastics. These categories determine the ability of a material to extinguish a flame after ignition. Several categories can be assigned based on burning rate, extinction time, droplet resistance, and whether the droplets produced are flammable or non-flammable. Each test material may be assigned several categories based on color and/or thickness. For a specific material selection for an application, the UL rating should be determined by the thinnest wall of the plastic part. The UL category must always be stated together with the thickness: simply stating the UL category without the thickness is not sufficient.
2. Brief description of UL94 classification categories
HB
Slow burning of a horizontal sample.
Burning speed is less than 76 mm/min with a thickness of less than 3 mm.
The burning rate is less than 38 mm/min with a thickness of more than 3 mm.
V-0
The combustion of the vertical sample stops within 10 s;
V-1
the formation of droplets is not allowed.
V-2
The combustion of the vertical sample stops within 30 s;
Drops of burning particles are allowed.
5V
The combustion of a vertical sample stops within 60 s after five exposures to flame with a duration of each exposure to the test sample of 5 s.
5VB
Samples in the form of wide plates can burn through and create holes.
5VA
Wide-plate specimens must not burn through (i.e., form holes) - this is the most stringent UL category.
If flammability is a safety requirement, then the use of HB category materials is generally not permitted. In general, HB materials are not recommended for electrical applications, with the exception of mechanical and/or decorative products. Sometimes there is a misunderstanding: non-fire resistant materials (or materials that are not referred to as fire resistant) do not automatically qualify as HB. The UL94HB category, although the least stringent, is a flammability category and must be verified through testing. 
Flame test on horizontal specimen
When testing vertical specimens, the same specimens are used as for HB testing. All parameters are recorded: burning time, smoldering time, moment of droplet appearance and ignition (or non-ignition) of the cotton lining. The difference between V1 and V2 is the burning droplets, which are the main source of flame or fire propagation. 
Vertical specimen ignition test

1st Test Stage 5V
Standard samples for determining flammability are fixed vertically and each sample is exposed to a flame five times with a flame height of 127 mm each time for 5 s. To comply with the test conditions, no specimen shall burn with flame or smolder for more than 60 s after the fifth exposure to flame. In addition, burning droplets should not be allowed to ignite the cotton pad underneath the samples. The entire procedure is repeated with five samples.

2nd Test Stage 5VA and 5VB
A wide plate of the same thickness as the plate samples is tested in a horizontal position with the same flame. The entire procedure is repeated with three plates.
These horizontal tests determine two classification categories: 5VB and 5VA.
Category 5VB allows through burning (with the formation of holes).
Category 5VA does not allow the formation of holes.
UL94-5VA testing is the most stringent of all UL testing methods. Materials in this category are used for fireproof casings of large office machines. For these applications with expected wall thicknesses of less than 1.5mm, glass fiber core grades should be used.
6. CSA Flammability (CSA C22.2 No. 0.6 Test A)
These Canadian Standards Association (CSA) flammability tests are conducted similar to the UL94-5V tests. But the conditions of these tests are stricter: each exposure to flame lasts 15 seconds. In addition, during the first four flame exposures, the sample should extinguish within 30 seconds, and after the fifth exposure, within 60 seconds (compare the UL94-5V test with five flame exposures of five seconds each).
The results of these CSA tests shall be considered consistent with the UL94-5V test results.
The purpose of the limited oxygen flammability index (LOI) is to measure the relative flammability of materials when burned in a controlled environment. The LOI index represents the minimum oxygen content in the atmosphere that can support a flame on a thermoplastic material.
The test atmosphere is an externally controlled mixture of nitrogen and oxygen. The fixed sample is ignited with an auxiliary flame, which is then extinguished. In successive test cycles, the oxygen concentration is reduced until the sample can no longer support combustion.
LOI is defined as the minimum oxygen concentration at which a material can burn for three minutes, or can maintain a sample burning spread over a distance of 50 mm.
The higher the LOI, the lower the likelihood of combustion.

Oxygen index test
8. Glow wire test IEC 695-2-1
Hot Wire Ignition (HWI) tests simulate thermal stresses that can be caused by a heat or ignition source, such as overloaded resistors or hot elements.
A sample of the insulating material is pressed for 30 seconds with a force of 1 N to the end of an electrically heated hot wire. The penetration of the tip of the hot wire into the sample is limited. Once the wire is removed from the sample, the time it takes to extinguish the flame and the presence of any burning droplets is recorded.
The sample is considered to have passed the hot wire test if one of the following situations occurs:
In the absence of flame or smoldering;
If the flame or smoldering of the sample, its surrounding parts and the lower layer goes out within 30 seconds after removing the hot wire, and also if the surrounding parts and the lower layer are not completely burned out. In the case of using thin paper as a bottom layer, this paper should not catch fire, or there should be no scorching of the pine board if used as a backing.
Actual live parts or enclosures are tested in a similar manner. The temperature level of the hot end of the wire depends on how the finished part is used:
With or without supervision,
With or without continuous load,
Located near or far from the central power point,
Contacts a live part or is used as a casing or cover,
Under less or more stringent conditions.

Glow wire test
Depending on the required level of severity of the environmental conditions surrounding the finished part, the following temperature values are preferred: 550, 650, 750, 850 or 960 °C. The appropriate test temperature should be selected by assessing the risk of failure due to unacceptable heating, ignition and flame spread. 
Laboratory bench for flammability testing
9. Needle flame tests IEC 695-2-2 
Needle flame test
Needle flame tests simulate the effects of small flames that can occur due to a fault within electrical equipment. To assess the likely spread of flame (burning or smoldering particles), either a layer of the test material, components normally surrounding the sample, or a single layer of tissue paper is placed under the sample. The test flame is applied to the sample for a specified period of time: usually 5, 10, 20, 30, 60 or 120 seconds. For special requirements, other levels of stringency may be adopted.
Unless otherwise specified in the relevant specification, a sample is considered to have passed the needle flame test if one of the following four situations occurs:
If the sample does not ignite.
If flame or burning or smoldering particles falling from the specimen cause fire to spread to surrounding parts or to a layer placed underneath the specimen, and if there is no flame or smoldering on the specimen at the end of exposure to the test flame.
If the burning duration does not exceed 30 seconds.
If the combustion spread specified in the relevant technical conditions has not been exceeded.
based on materials from www.polimer.net
Advertisements for the purchase and sale of equipment can be viewed at
You can discuss the advantages of polymer brands and their properties at
Register your company in the Enterprise Directory
Experimental study of the strength and deformation properties of polymers includes several stages:
- - selection of the type of samples and their production;
- - preparation of devices for securing samples in testing machines;
- - preparation of testing machines and instruments for measuring deformation.
A feature of polymer testing is the need for precision
Maintain the specified temperature up to a degree. To do this, use special thermostats with automatic devices to maintain the temperature. It is very convenient to test in a temperature controlled room, but this is generally acceptable for testing at room temperature.
The shape of polymer samples is usually determined by the features of their manufacturing technology. Samples from isotropic materials can be either cylindrical or flat, and samples from anisotropic materials with a load-bearing base (getinax, textolite, fiberglass) can only be flat.
When testing flat samples in tension or compression, strength in the axial direction, elastic modulus and Poisson's ratios are determined
in mutually perpendicular directions. In accordance with GOST 11262, samples of types 1-3 are used for testing, the shape and dimensions of which are indicated in Fig. 2.60 and in table. 2.11.
Rice. 2.60.
Table 2.11. Dimensions of main specimens for tensile testing
Note. It is allowed to use samples 2 and 3 with a thickness of 1 mm when manufacturing them from sheet materials and samples of type 2 with a thickness of 3 mm when manufacturing them from filled polymer materials.
In the case of testing the material recipe, processing modes and during research work, it is allowed to use samples of types 4 and 5, shown in Fig. 2.61 and table. 2.12.

Rice. 2.61.
Table 2.12. Dimensions of tensile test specimens used in developing material formulations, processing modes and in research work
When producing samples by mechanical processing from products and semi-finished products, including sheets and plates, the maximum permissible thickness should be 3 mm for samples of type 1, corresponding to the thickness of the product or semi-finished product, but not more than 10 mm for sample of type 2.
When making a type 2 sample from a slab or product whose thickness is more than 10 mm, it is brought to 10 mm by mechanical processing. Processing to the required thickness is carried out on both sides in the longitudinal direction of the sample, unless there are other instructions in the regulatory and technical documentation for the material.
Samples must have a smooth, even surface, without swelling, chips, cracks, cavities and other visible defects.
To test isotropic materials, at least five samples are used, to test anisotropic materials, at least five samples are selected in places and directions that must comply with the regulatory and technical documentation for the material,
The samples are conditioned for at least 16 hours according to GOST 12423 at a temperature of 23±2 °C and relative humidity (50±5)%, unless otherwise specified in the technical documentation for the material.
The time from the completion of production of molded samples to their testing must be at least 16 hours, including the time for their conditioning.
When making samples from semi-finished products or products, the time from the end of the molding of semi-finished products or products to the start of testing samples from them must be at least 16 hours, including the time for their
conditioning, if there are no other instructions in the regulatory and technical documentation for the material.
Samples for compression testing according to GOST 4651 must have the shape of a rectangular prism, straight cylinder or straight tube. The supporting planes of the sample must be perpendicular to the direction of application of the load during compression and parallel to each other within 0.1% of the height of the sample.
The height of samples A in millimeters is calculated depending on the ratio of the flexibility coefficient to the smallest radius of gyration using the following formulas: - for a rectangular prism with a square or rectangular cross section
For straight cylinder
For a straight tube with a base in the form of a cylindrical crown
Where X- flexibility factor; A - length of the side of the base of a prism with a square base; Kommersant - the length of the shorter side of the base of a rectangular prism with a rectangular cross-section; d- diameter of a straight cylinder; d x - inner diameter of the tube; D- outer diameter of the tube.
Flexibility factor X calculated by the formula
Where h p - the reduced height of the sample, equal when testing samples without clamps A 0, and for testing samples with clamps L,/2; A, - the distance between with clamps; I - minimum radius of gyration, calculated by the formula i= V(// A); I- the basic minimum moment of inertia of the cross-section of the sample; L- cross-sectional area of the sample.
The flexibility coefficient of the sample must be equal to 10. In cases where the sample loses stability during testing, the flexibility coefficient is reduced to 6.
The sample height is set from 10 to 40 mm. The preferred sample height is 30 mm.
The tensile strength of most plastics is 30-80 MPa, so any machines with a capacity of 0.25-5 tons are practically suitable for testing polymers. In addition, the testing machine must have a fairly low scale division of the loading device (5-50 N), and also a variator of the speed of movement of the load gripper, including its manual drive.
A prerequisite when working on machines designed for testing polymers is to ensure a constant deformation rate.
In machines with a pendulum force meter, the speed of movement specified by the movement of the lower grip will not correspond to the speed of deformation of the sample. This is explained by the fact that as the load increases and as the pendulum deviates, the upper grip associated with the pendulum system of levers also moves. In machines with a dynamometer connected to the upper grip, it is necessary to take into account the error arising from the low rigidity of the dynamometer. The higher the rigidity of the dynamometer, the more accurately the condition of constant deformation rate is maintained. In modern designs of testing machines, the force meter is rigid.
The use of electrical methods for recording forces in rigid dynamometers, made in the form of an elastic element of low compliance, ensures almost any measurement accuracy and eliminates the need to make corrections for a given deformation rate. Measuring forces using a rigid elastic element is especially useful when carrying out relaxation tests on polymers. In this case, almost ideal conditions are provided for maintaining a constant deformation of the sample.
Due to their low rigidity and strength, polymers can be tested on simple test benches. In this case, loading is carried out by weights acting on the sample directly or using lever devices. A smooth increase in the load on the sample is achieved by slowly filling the loading device with water or by using a screw drive. To reduce the dimensions of the loading device, lead disks or lead shot are used, which in the latter case also allows for smooth adjustment of the load.
The deformation of a stretched sample is measured, as a rule, using strain gauges (mechanical, electrical or optical). Mechanical strain gauges can be successfully used to measure small elastic deformations of a sample.
Electrical methods for measuring deformation during mechanical testing of plastic samples are also widely used. In this case, deformable resistance sensors (strain gauges) made of wire or foil are used, glued to the working area of the sample.
As already mentioned, long-term durability tests are usually carried out in the creep mode, and the vast majority of such studies are carried out under the action of a tensile force. There are several
fundamentally different setups for testing durability under tensile creep conditions. In Fig. As an example, Figure 2.62 shows two diagrams of installations for testing at constant voltage. As deformation develops, the cross-sectional area of the working part of the sample decreases (formation of a “neck”), as a result of which, if a constant force acts on the sample, the stresses in the working part of the sample will increase over time. The main feature of the first installation (Fig. 2.62, A) is that in order to maintain a constant voltage, the voltage-setting mechanism (lever) is made in the form of a cam (“Zhurkov’s snail”), which allows the lever arm to be reduced R, and, consequently, the acting force is proportional to the change in the cross-sectional area of the sample. This ensures constant voltage.

Rice. 2.62. Schemes of installations for testing under conditions of creep during tension: in the constant stress mode using the Zhurkov “snail” (a), using the Andrade load (b) and in the constant force mode (c): 1 - sample; 2 - lever arm; 3 - cargo; 4 - cable
In the second installation (Fig. 2.62, b) in order to compensate for the increase in voltage and maintain it at a constant level, the so-called Andrade device is used, in which the profile of the figured load is calculated according to the formula
Where T- mass of cargo; p is the density of the liquid.
According to the third scheme (Fig. 2.62, V) the arm of the lever 1 2, with the help of which the tension is created, remains almost constant, that is, a constant load is applied to the sample. If samples of materials with insignificant elongation at the moment of rupture are tested in such an installation, for example, glass-, carbon- and boron-plastics, organic glasses, etc., then it can be assumed that a constant stress is applied to the sample until the moment of its destruction.
Durability tests are carried out at various stresses and temperatures, bringing samples to destruction. During the tests, readings are taken about the deformation of the samples, from which creep curves are constructed.
It should be noted that when carrying out durability tests in liquid media, swelling stresses will be created in the material due to the diffusion of the medium into it; taking into account such stresses is difficult due to test conditions. In this case, the Zhurkov snail and the Andrade device will not ensure constant voltage.
In the installation shown in Fig. 2.63, vessel 3 and the device for fastening the sample in it are made of corrosion-resistant metals. Loading mechanism 6 allows you to change the acting force and maintain a constant voltage in the sample.

Rice. 2.63. Installation for testing plastics in aggressive environments under load (a) and sample mounting unit (b): 1 - table; 2 - bath with hot water; 3 - a vessel with an aggressive liquid; 4 - sample; 5 - ball cooler; 6 - loading mechanism; 7 - cargo; 8 - movable bar; 9 - hairpin; 10 - bolt; 11 - sample; 12 - support bar
In the installation shown in Fig. 2.64, the working part of the sample is placed in a thermostatic vessel 7 with two necks. The sample passes through specially made rubber stoppers that seal the vessel hermetically. Liquid is poured through the fitting using a funnel attached to a rubber hose 10 (there are two of them in the upper part of the vessel, one of them is intended for air outlet). During testing, ball-type reflux condensers can be connected to these fittings to prevent liquid evaporation. To ensure the required test temperature to the heating jacket of the vessel in the fittings 11 through flexible hoses, coolant can be supplied from a thermostat equipped with a centrifugal pump.

Rice. 2.64. Installation diagram for testing plastics for durability and creep: 1 - lever system; 2 - clamping clips; 3 - corrugated jaws; 4 - rubber stopper; 5 - loads; 6 - sample; 7 - vessel with an aggressive environment; 8 - frame; 9 - dial indicator; 10, 11 - fittings
Using basic devices (Fig. 2.63 and 2.64), you can assemble installations with any number of samples. Installations can be equipped with devices that allow you to measure and record deformation during testing, as well as construct creep curves.
In Fig. Figure 2.65 shows a diagram of durability tests under compressive creep conditions.

Rice. 2.65. Diagram of the device for testing under compression: / - sample; 2- bed; 3- thermostat; 4 , 13 - stamps; 5 , 12 - centering hinges; 6,8 - plates; 7 - lever; 9 - cell; 10 - guide; 11 - heater; 14 - cargo
When determining the amount of shrinkage of a particular polymer material, samples made according to GOST 12015 from thermosets and according to GOST 12019 from thermoplastics are used. To determine technological and operational shrinkage, samples are used, the shape and dimensions of which are indicated in the table. 2.13.
Table 2.13. Shape and dimensions of samples to determine shrinkage
When testing thermosetting materials, samples of type 1.3 are used.
Tests are carried out on at least three samples obtained by sequential molding in the same cavity of an injection mold (for thermoplastics) or a press mold (for thermosets).
When determining the technological shrinkage of thermosets, the dimensions of the mold matrix and the sample are accurately recorded in the direction perpendicular to the direction of molding. When testing thermoplastics, the dimensions of the injection mold matrix and the sample are recorded in directions perpendicular and parallel to the molding direction.
When determining operational shrinkage, the dimensions of the sample are determined before and after heat treatment in the direction perpendicular and parallel to the direction of molding.
After removal from the mold, thermoset samples are cooled to room temperature by placing them under a load on a material with low thermal conductivity to avoid warping. Before measurement, samples are stored at a temperature of 23±2 °C and a relative humidity of 50±5%. The dimensions of the samples after pressing are measured after 16-72 hours.
The length of the bars is measured from end to end or between marks with an error of no more than 0.02 mm. Before determining the length, samples are placed on a smooth metal or glass surface to detect deformations and deflections. Samples with such defects are not used for testing. The width of the bar is taken as the arithmetic mean of three length measurements.
Thermoplastic samples are measured after they have been kept from the moment of manufacture for at least 16 hours and no more than 24 hours at a temperature of 23±2 °C, including conditioning time.
To determine operational shrinkage, measurements are carried out in the same way as when determining process shrinkage. To carry out heat treatment, samples are placed in a thermostat. To avoid deformation, the measured thermoset samples are placed in a thermostat on a stand so that they do not touch each other.
The heat treatment conditions for thermoset plastics are usually specified in the technical specifications for the material. In the absence of these instructions, the heat treatment temperature should be 80±3 °C for urea-formaldehyde molding compounds, and 110±3 °C for all other types of materials. The heat treatment time is usually 168 ± 2 hours, with accelerated testing - 48 ± 1 hour. The temperature is measured directly at the location of the samples.
When determining operational shrinkage at a different temperature, it is necessary to take into account the coefficient of linear expansion of the samples.
After the end of heat treatment, samples from thermosetting molding masses are removed from the thermostat, cooled to a temperature of 23±2 °C and kept at this temperature and a relative air humidity of 50±5% for at least 3 hours, after which the samples are measured again at the same temperature with an error of not more than 0.02 mm.
The conditions for heat treatment of thermoplastics are not strictly regulated and are selected depending on the type of material and operating conditions of the products.
Technological shrinkage 5 T in percent is calculated by the formula
where / 0 is the size of the mold, mm; /, - sample size, mm.
where /, is the size of the sample before heat treatment, mm; / 2 - sample size after heat treatment, mm.
Shrinkage anisotropy is calculated using formula (20).