Structured planning. Project management structural planning structural planning includes. Test your knowledge
Annotation: Structural planning. Scheduling. Operational management. Practical classes on structural and calendar planning. Test assignments.
2.1. Theoretical course
2.1.1. Structural planning
Structural planning includes several stages:
- dividing the project into a set of individual works, the implementation of which is necessary for the implementation of the project;
- constructing a network diagram describing the sequence of work;
- assessment of the time characteristics of work and analysis of the network diagram.
The main role at the stage of structural planning is played by the network diagram.
Network diagram is a directed graph in which the vertices indicate the work of the project, and the arcs indicate the temporary relationships of the work.
The network diagram must satisfy the following properties.
- Each job corresponds to one and only one vertex. No work can be represented on the network diagram twice. However, any job can be divided into several separate jobs, each of which will correspond to a separate vertex of the graph.
- No job can begin before all the jobs immediately preceding it have been completed. That is, if arcs enter a certain vertex, then work can begin only after the completion of all the works from which these arcs emerge.
- No job that immediately follows a job can begin before it ends. In other words, if several arcs exit from a job, then none of the jobs that those arcs are part of can begin until that job ends.
- The beginning and end of the project are indicated by activities with zero duration. Such work is called milestones and mark the beginning or end of the most important stages of the project.
Example. As an example, consider the project "Development software package". Let us assume that the project consists of work, the characteristics of which are given in Table 2.1.
| Work number | Job title | Duration |
|---|---|---|
| 1 | Start of the project | 0 |
| 2 | Formulation of the problem | 10 |
| 3 | Interface development | 5 |
| 4 | Development of data processing modules | 7 |
| 5 | Database structure development | 6 |
| 6 | Populating the Database | 8 |
| 7 | Debugging the software package | 5 |
| 8 | Testing and bug fixing | 10 |
| 9 | Preparation of program documentation | 5 |
| 10 | Completion of the project | 0 |
Network diagram for of this project shown in Fig. 2.1. There are vertices on it corresponding to ordinary work, are outlined with a thin line, and the project milestones are outlined with a thick line.
Rice. 2.1.
The network diagram allows you to find the critical activities of the project and its critical path using given values of work durations.
Critical is a job for which a delay in its start will delay the completion of the project as a whole. Such work does not have a reserve of time. Non-critical activities have a certain margin of time, and within this margin their start may be delayed.
Critical path– this is the path from the initial to the final vertex of the network diagram, passing only through critical activities. The total duration of the critical path activities determines the minimum project implementation time.
Finding the critical path comes down to finding critical jobs and is performed in two stages.
- Calculation early start time each work of the project. This value shows the time before which work cannot start.
- Calculation late start time each work of the project. This value indicates the time after which work cannot begin without increasing the duration of the entire project.
Critical jobs have equal early and late start times.
Let us denote – the work execution time , – the early work start time , – the late work start time . Then

where is the set of jobs immediately preceding job . Early time initial work project is taken equal to zero.
Since the last activity of the project is a milestone of zero duration, its earliest start time coincides with the duration of the entire project. Let's denote this quantity. Now it is taken as the late start time of the last job, and for the remaining jobs the later start time is calculated using the formula:

Here are many works directly following the work.
Schematic calculations of early and late start times are shown, respectively, in Fig. 2.2 and Fig. 2.3.

Rice. 2.2.

Rice. 2.3.
Example. Let's find the critical work and the critical path for the project "Development of a software package", the network diagram of which is shown in Fig. 2.1, and the duration of the work is calculated in days and is given in Table 2.1.
First, we calculate the earliest start time of each job. Calculations start from the initial work and end with the final work of the project. The process and results of the calculations are shown in Fig. 2.4.
The result of the first stage, in addition to the early start time of work, is the total duration of the project ![]() .
.
At the next stage, we calculate the later start time of work. Calculations begin in the last and end in the first work of the project. The process and results of the calculations are depicted in Figure 2.5.

Rice. 2.4.

Rice. 2.5.
The summary results of the calculations are given in Table 2.2. Critical work is highlighted in it. The critical path is obtained by connecting the critical activities on the network diagram. It is shown by dotted arrows in Fig. 2.6.
| Job | 1 | 2 | 3 | 4 | 5 | 6 | 7 | 8 | 9 | 10 |
| Early start time | 0 | 0 | 10 | 16 | 10 | 16 | 24 | 29 | 29 | 39 |
| Late start time | 0 | 0 | 12 | 17 | 10 | 16 | 24 | 29 | 34 | 39 |
| Time reserve | 0 | 0 | 2 | 1 | 0 | 0 | 0 | 0 | 5 | 0 |
The essence of planning is to determine the goals of the organization, ways and methods of achieving them; goals describe the desired state of the organization. Thus, without planning, purposeful management of an organization is impossible. In addition, the plan as a result of the planning process has other, more private functions:
- reflexive – awareness of the organization’s image by the external and internal public;
- motivational – encouraging staff to be productive;
- criterial – justification of decisions made and assessment of actions taken.
Plans can be strategic and current, current - periodic and one-time. They all differ in planning time horizons and together form a hierarchy, since more long term plans are detailed in less long-term ones. The farthest planning horizon is strategic. Periodic plans can be drawn up for the long-term, medium-term (tactical) and short-term (operational) perspective. One-time plans most often take the form of projects and programs (as a rule, programs include several projects) to achieve certain specific (for example, innovative) or situational (for example, anti-crisis) goals. One-time plans can be either long-term or short-term.
It should be emphasized that the same horizons can mean different planning periods for different organizations and, as a rule, are directly proportional to their size, the duration of activity cycles (production, reporting, elections, etc.), the pace of development of the field of activity (industry) and stability external environment. If for a small organization the strategic perspective may be 1-2 years, then for a large organization the same period will most likely be the current planning horizon. But for those same large organizations operating in dynamically developing areas or in conditions of social transformation, the planning horizons will be closer than in stable conditions.
The most typical characteristics of strategic and periodic plans of large organizations are presented in table. 7.2.
Table 7.2
Characteristics of the organization's basic plans
|
Types of plans |
Planning horizons |
Planning instances |
Types of planning criteria |
|
|
Strategic |
5-10 or more years |
Organization |
Mission, main directions and scope of activities |
Quality |
|
Long term |
Organization |
Specific areas of specialization, structural changes |
Qualitatively quantitative |
|
|
Medium-term (tactical) |
Organization, divisions |
Specific goals taking into account expenses and income (business planning) |
Quantitative |
|
|
Short-term (operational) |
1 year (quarter, month, week, day) |
Organization, divisions, performers |
Tasks taking into account material and human resources |
Quantitative "point" |
Strategic planning differs from the current one not only in its time horizon, but also in its methodological features. Strategic planning is based on anticipating possible future changes and development trends external environment organizing and identifying the most promising areas and directions organizational activities. It follows that strategic planning is the planning of qualitative indicators of structural organizational changes. It does not imply any specific actions, but allows in the process strategic management constantly monitor the degree of compliance of the current state and development of the organization with the forecast of future operating conditions and, on this basis, implement current planning.
In contrast to strategic planning, current planning involves extrapolation of existing trends in the organization’s activities into the future (planning from what has been achieved). Current planning is, first of all, planning quantitative changes through the distribution of financial, technological and human resources. This is the operation of numbers obtained from an analysis of the short-, medium- and long-term needs of the organization. The main feature of current planning is its flexibility, i.e. ensuring the organization's readiness to quickly respond to environmental changes. In general, we can say that current planning is a view of the future of an organization from its present, and strategic planning is a view of its present from the future.
Regardless of the type of planning and the approach used to it, the collection and analysis of the necessary data, the preparation of plans as documents that are binding, as well as control over their implementation are carried out by the planning services (planning departments) of organizations. Planning document formats vary depending on their time horizons. Strategic and long-term plans are most often written in text form, broken down into sections by type of activity, medium-term and short-term plans - in tabular form, broken down by divisions and gradations: “what should be done”, “by whom”, “by what means”, “ in what form and volume" and "by what date".
- Strategic planning is the basis of strategic management, which is now very often identified as a special type of management activity.
Laboratory work No. 4.
Project management by means
Microsoft Project2007
The laboratory work is intended to familiarize you with the main stages of project management technology in the environment MicrosoftOffice Project 2007.
A brief description of the theoretical foundations of network and scheduling planning as the foundation of automated project management technology is given. Techniques for drawing up a project plan are discussed.
1. Basic concepts of project management
Project is a set of activities or work distributed over time aimed at achieving a goal. Examples of projects are the construction of buildings, complexes, enterprises, the development of a new type of product, the modernization of production, the development of a software product, etc.
The project has certain properties.
A project always has a clearly defined goal, which is expressed in obtaining some result. Achieving this result signifies the successful completion and completion of the project. For example, for a building construction project, the result is the building itself, accepted for operation.
The project has a clearly defined beginning, which coincides with the beginning of the first work aimed at achieving the goal. The beginning can be set prescriptively, or calculated as a result of drawing up a work plan for the project.
A project has a clearly defined end, which coincides with the end of the last work aimed at achieving a given result. Like the beginning, the end of the project can be specified prescriptively, or calculated when drawing up a work plan. For example, for a building construction project, the end of the project coincides with the date of its commissioning/acceptance certificate.
The project is carried out by a team, which includes the project leader, managers, and performers. In addition to the main team, it may involve third-party performers, teams and organizations that are involved on a temporary basis to perform individual work.
When implementing the project, material resources are used. Their nomenclature and quantity are determined by the nature of the project and the work included in it. So, when building a house, sand, crushed stone, cement, brick, etc. are used.
The project has a budget. The cost of the project consists of the cost of spent material resources, labor costs for the team implementing it and other expenses associated with the characteristics of specific types of work.
The project has three types of restrictions.
Budget constraints set a limit on the cost of the entire project or individual types of work.
Time limits set deadlines for completing either the entire project or some work. For example, test trials should be carried out in the presence of a customer representative who will be present for a specified period of time.
Resource limitations are determined by limited team composition or material resource arrival schedules.
2. Network planning and management
Structural planning. Scheduling. Operational management.
2.1. Structural planning
Structural planning includes several stages:
dividing the project into a set of individual works, the implementation of which is necessary for the implementation of the project;
constructing a network diagram describing the sequence of work;
assessment of the time characteristics of work and analysis of the network diagram.
The main role at the stage of structural planning is played by the network diagram.
Network diagram is a directed graph in which the vertices indicate the work of the project, and the arcs indicate the temporary relationships of the work.
The network diagram must satisfy the following properties.
Each job corresponds to one and only one vertex. No work can be represented on the network diagram twice. However, any job can be divided into several separate jobs, each of which will correspond to a separate vertex of the graph.
No job can begin before all the jobs immediately preceding it have been completed. That is, if arcs enter a certain vertex, then work can begin only after the completion of all the works from which these arcs emerge.
No job that immediately follows a job can begin before it ends. In other words, if several arcs exit from a job, then none of the jobs that those arcs are part of can begin until that job ends.
The beginning and end of the project are indicated by activities with zero duration. Such work is called milestones and mark the beginning or end of the most important stages of the project.
Example. As an example, consider the project “Development of a software package”. Let us assume that the project consists of work, the characteristics of which are given in Table 2.1.
|
Table2. 1 |
||
|
Work number |
Job title |
Duration |
|
Start of the project | ||
|
Formulation of the problem | ||
|
Interface development | ||
|
Development of data processing modules | ||
|
Database structure development | ||
|
Populating the Database | ||
|
Debugging the software package | ||
|
Testing and bug fixing | ||
|
Preparation of program documentation | ||
|
Completion of the project | ||
The network diagram for this project is shown in Fig. 2.1. On it, the vertices corresponding to normal work are outlined with a thin line, and the project milestones are outlined with a thick line.

Rice.2. 1. Project network diagram
The network diagram allows you to find the critical activities of the project and its critical path using given values of work durations.
Critical is a job for which a delay in its start will delay the completion of the project as a whole. Such work does not have a reserve of time. Non-critical activities have a certain margin of time, and within this margin their start may be delayed.
Critical path– this is the path from the initial to the final vertex of the network diagram, passing only through critical activities. The total duration of the critical path activities determines the minimum project implementation time.
Finding the critical path comes down to finding critical jobs and is performed in two stages.
Calculation early start time each work of the project. This value shows the time before which work cannot start.
Calculation late start time each work of the project. This value indicates the time after which work cannot begin without increasing the duration of the entire project.
Critical jobs have equal early and late start times.
Let us denote – the time of work completion, – the early start time of work, – the late start time of work. Then
![]()
where is the set of jobs immediately preceding the job. The early start time of the project is assumed to be zero.
Since the last activity of the project is a milestone of zero duration, its earliest start time coincides with the duration of the entire project. Let's denote this quantity. Now the late start time of the last job is taken as the later start time, and for the remaining jobs the later start time is calculated using the formula:
![]()
Here are a lot of works that immediately follow the work.
Schematic calculations of early and late start times are shown, respectively, in Fig. 2.2 and Fig. 2.3.

Rice.2. 2. Scheme for calculating early start time

Rice.2. 3. Scheme for calculating late start time
Example. Let's find the critical work and the critical path for the project "Development of a software package", the network diagram of which is shown in Fig. 1, and the duration of the work is calculated in days and is given in Table 1.
First, we calculate the earliest start time of each job. Calculations start from the initial work and end with the final work of the project. The process and results of the calculations are shown in Fig. 2.4.
The result of the first stage, in addition to the early start time of work, is the total duration of the project.
At the next stage, we calculate the later start time of work. Calculations begin in the last and end in the first work of the project. The calculation process and results are shown in Figure 2.5.

Rice.2. 4. Calculating the earliest start time

Rice.2. 5. Calculating the latest start time for work
The summary results of the calculations are given in Table 2.2. Critical work is highlighted in it. The critical path is obtained by connecting the critical activities on the network diagram. It is shown by dotted arrows in Fig. 2.6.
|
Table 2.2 |
||||||||||
|
Early start time | ||||||||||
|
Late start time | ||||||||||
|
Time reserve | ||||||||||

Rice.2.6 . Project Critical Path
After calculating the values and for each job, calculate reserve time:
This value shows how much you can delay the start of work without increasing the duration of the entire project.
For critical work, the slack time is zero. Therefore, the project manager's efforts should be directed primarily at ensuring the timely completion of these works.
For non-critical work, the time slack is greater than zero, which gives the manager the opportunity to maneuver their start time and the resources they use. The following options are possible.
The start of work is delayed by an amount not exceeding the reserve time, and the resources required for work are directed to perform work on the critical path. This can result in a reduction in the duration of critical work and the project as a whole;
Underutilization of non-critical work with resources. As a result, its duration increases within the time reserve, and the freed resource is used to perform critical work, which will also lead to a decrease in the duration of it and the entire project.
In the example project, work 3, 4 and 9 have a reserve time according to Table 2.
Structural planning
Structural planning includes several stages:
1. dividing the project into a set of individual works, the implementation of which is necessary for the implementation of the project;
2. construction of a network diagram describing the sequence of work;
3. assessment of the time characteristics of work and analysis of the network diagram.
The main role at the stage of structural planning is played by the network diagram.
Network diagram is a directed graph in which the vertices indicate the work of the project, and the arcs indicate the temporary relationships of the work.
The network diagram must satisfy the following properties.
1. Each job corresponds to one and only one vertex. No work can be represented on the network diagram twice. However, any job can be divided into several separate jobs, each of which will correspond to a separate vertex of the graph.
2. No work can begin before all immediately preceding work has been completed. That is, if arcs enter a certain vertex, then work can begin only after the completion of all the works from which these arcs emerge.
3. No work that immediately follows a certain work can begin before it ends. In other words, if several arcs exit from a job, then none of the jobs that those arcs are part of can begin until that job ends.
4. The beginning and end of the project are indicated by activities with zero duration. Such work is called milestones and mark the beginning or end of the most important stages of the project.
Example. As an example, consider the project “Development of a software package”. Let us assume that the project consists of works, the characteristics of which are given in Table 1.
Table 1.
The network diagram for this project is shown in Fig. 1. On it, the vertices corresponding to ordinary work are outlined with a thin line, and with a thick line project milestones.
Rice. 1. Project network diagram
The network diagram allows you to find the critical activities of the project and its critical path using given values of work durations.
Critical is a job for which a delay in its start will delay the completion of the project as a whole. Such work does not have a reserve of time. Non-critical activities have a certain margin of time, and within this margin their start may be delayed.
Critical path– this is the path from the initial to the final vertex of the network diagram, passing only through critical activities. The total duration of the critical path activities determines the minimum project implementation time.
Finding the critical path comes down to finding critical jobs and is performed in two stages.
1. Calculation early start time each work of the project. This value shows the time before which work cannot start.
2. Calculation late start time each work of the project. This value indicates the time after which work cannot begin without increasing the duration of the entire project.
Critical jobs have equal early and late start times.
Let us denote – the work execution time , – the early work start time , – the late work start time . Then

where is the set of jobs immediately preceding job . The early start time of the project is assumed to be zero.
Since the last activity of the project is a milestone of zero duration, its earliest start time coincides with the duration of the entire project. Let's denote this quantity. Now it is taken as the late start time of the last job, and for the remaining jobs the later start time is calculated using the formula:

Here are many works directly following the work.
Schematic calculations of early and late start times are shown, respectively, in Fig. 2 and Fig. 3.

Rice. 2. Scheme for calculating early start time

Rice. 3. Scheme for calculating late start time
Example. Let's find the critical work and the critical path for the project "Development of a software package", the network diagram of which is shown in Fig. 1, and the duration of the work is calculated in days and is given in Table 1.
First, we calculate the earliest start time of each job. Calculations start from the initial work and end with the final work of the project. The process and results of the calculations are shown in Fig. 4.
The result of the first stage, in addition to the early start time of work, is the total duration of the project ![]() .
.
At the next stage, we calculate the later start time of work. Calculations begin in the last and end in the first work of the project. The calculation process and results are shown in Figure 5.

Rice. 4. Calculating the earliest start time

Rice. 5. Calculating the latest start time for work
The summary results of the calculations are given in Table 2. Critical work is highlighted in it. The critical path is obtained by connecting the critical activities on the network diagram. It is shown by dotted arrows in Fig. 6.
Table 2.

Rice. 6. Project Critical Path
After calculating the values and for each work, calculate reserve time :
This value shows how much you can delay the start of work without increasing the duration of the entire project.
For critical work, the slack time is zero. Therefore, the project manager's efforts should be directed primarily at ensuring the timely completion of these works.
For non-critical work, the time slack is greater than zero, which gives the manager the opportunity to maneuver their start time and the resources they use. The following options are possible.
1. Delay in the start of work by an amount not exceeding the time reserve, and the resources required for work are directed to perform work on the critical path. This can result in a reduction in the duration of critical work and the project as a whole;
2. Underutilization of non-critical work with resources. As a result, its duration increases within the time reserve, and the freed resource is used to perform critical work, which will also lead to a decrease in the duration of it and the entire project.
In the example project, work 3, 4 and 9 have a reserve time according to Table 2.
Scheduling
At the scheduling stage, a calendar schedule is developed, which is called Gantt chart. The Gantt chart displays the following project parameters:
1. structure of work obtained on the basis of the network diagram;
2. composition of resources used and their distribution between jobs;
3. calendar dates to which the start and completion of work are tied.
Let's consider the construction of a calendar schedule using the example of the project "Development of a software package." First of all, you need to decide on the resources that will be used by this project. Let us assume that only performers act as resources, and they are distributed among jobs according to Table. 3.
Table 3.
| Job no. | Job title | Executor |
| Start of the project | - | |
| Formulation of the problem | Stage Director | |
| Interface development | Programmer1 | |
| Development of data processing modules | Programmer1 | |
| Database structure development | Programmer2 | |
| Populating the Database | Programmer2 | |
| Debugging the software package | Programmer1 Programmer2 | |
| Testing and bug fixing | Programmer1 Programmer2 Director | |
| Preparation of program documentation | Stage Director | |
| Completion of the project | - |
Let's choose the start date of the project - September 7, 2009. (Monday). When compiling a calendar schedule, only working days are taken into account. All Saturdays and Sundays are considered non-working, as well as official holidays, the nearest of which is November 4.
The calendar schedule (Gantt chart) is shown in Fig. 7, where diamonds indicate milestones, solid lines indicate the duration of work, solid lines with arrows indicate the reserve time for work, dotted lines indicate the connection between the end of previous and the beginning of subsequent work.

Rice. 7. Project schedule

Rice. 8. Resource load charts
Based on the Gantt chart, a resource load chart. This graph shows the percentage of utilization of a specific labor resource during the project. The x-axis shows the time interval of the project, and the y-axis shows the total percentage of the contractor’s workload for all project tasks that he is performing at the current time.
Usually the performer is completely occupied with solving a certain task and, upon completion, moves on to the next one. This corresponds to 100% load. However, in some cases, he can be involved in 2 or more tasks in parallel, allocating part of his working time to solve them. For example, two tasks of 50% each, that is, half a working day per task. In this case, the resource load graph allows you to monitor the total employment of the performer and identify possible periods of overload when he is scheduled to do more work than he can complete during the working day. This is evidenced by the total workload of more than 100%.
An example of resource load graphs for the “Software development” project is shown in Fig. 8. It is built on the assumption that each employee is 100% engaged in completing the task planned for him. It is clear from the graphs that the Director is overloaded in the period from October 16 to October 23, since he is assigned two parallel jobs during this period. The area of its overload is highlighted on the corresponding graph by hatching.
Operational management
At the stage operational management work on the project is carried out and the progress of its implementation is continuously monitored. No matter how good the initial plan, life will definitely make adjustments to it. Therefore, the manager’s tasks are:
1. tracking the actual work schedule;
2. comparison of the actual schedule with the planned one;
3. making decisions to eliminate emerging deviations from the plan;
4. Re-planning of the project in case of significant deviations.
The first two tasks are solved using a Gantt chart. On it, parallel to the work duration lines, lines are drawn indicating the percentage of actual completion of these works. This makes it easy to detect any deviations that have occurred.
The method for eliminating deviations depends on the available resource manager. To complete delayed work, you can either involve additional workers(additional resources), or use the same composition of workers overtime. In both cases, eliminating the deviation will have to be paid for by increasing the cost of the project (previously unplanned payment for additional workers, resources and overtime).
If the deviation is such that it cannot be corrected by attracting additional and overtime resources, or the increase in project cost is unacceptable, it is necessary to reschedule project and do the following:
1. completed works are attributed zero values duration;
2. for partially completed work, duration values are set corresponding to the remaining amount of work;
3. structural changes are made to the network schedule in order to eliminate the work that turned out to be unnecessary and add others that were previously unplanned;
4. re-calculation of the critical path and re-scheduling of the project.
After creating the adjusted project, it is approved by management and its implementation and operational management begins. This adjustment can be made several times.
Control questions
1. What stages are included in the structural planning methodology?
2. What is a network diagram?
3. What properties does a network diagram have?
4. What is critical work?
5. What is the critical path?
6. What are the steps in finding the critical path?
7. How is the early start time calculated?
8. How is late start time calculated?
9. How to find critical jobs based on the early and late start times?
10. What is the operating time reserve?
11. How can the operating time reserve be used?
12. What is a Gantt chart?
13. Give an example of a Gantt chart.
14. What is the purpose of the resource load chart?
15. How can you find resource overload based on the resource load graph?
16. Give an example of a resource load graph.
17. What is the essence of the operational management process?
18. What actions should be performed when replanning a project in the process of operational management?
Laboratory work 1. Drawing up and calculating a network diagram
Laboratory work 2. Compilation and calculation calendar plan
Before we start talking about project development and planning, it’s worth a little refresher on our understanding of planning as such. The essence of planning is to set goals and determine ways to achieve them by creating a set of activities and actions necessary for implementation, using methods and ways of implementing activities and actions, linking the resources required to perform and coordinating the functions performed by project participants. It is with the issue of planning that we will begin the first lesson (we will immediately make a small disclaimer: there is a lot of information on the development and planning of projects, so we will present it in a concentrated form, dwelling in detail only on the most important points).
Project planning
The work of drawing up a plan includes all stages of the creation and implementation of the project. It begins with the development of the project concept by the leader (project manager), continues with the selection of strategic decisions, development of details, conclusion of contracts and execution of work, and ends with the completion of the project.
At the planning stage, the main parameters for the implementation of the project are established. These include:
- Duration of each controllable element of the project
- Need for resources (financial, material and technical and labor)
- Delivery time necessary equipment, components, materials, raw materials, etc.
- Timing and volumes of attracting organizations (construction, design, etc.)
Any process and any project planning procedure must ensure that the project is completed on time and in compliance with all requirements, including cost, standards and quality. In addition, in a well-organized project, a separate body should be responsible for performing each function and achieving each goal: for the mission of the project - the project manager, for private goals - responsible persons, etc. It is for this purpose that it is customary to develop a responsibility matrix that defines the functionality of performers and specifies the range of their work.
The higher the level of the governing body, the more generalized it makes decisions on the management of lower divisions. As the hierarchical level increases, the time intervals between setting tasks, monitoring their implementation, etc. increase. In these intervals, lower-level units must work independently and independently of their peers. Their independent work is provided with reserves of resources, which also need to be planned.
Main goal of planning- this is the construction of a project implementation model necessary for coordinating the actions of those involved in the project. Thanks to this model, the order according to which work will be carried out, etc. is established.
At the first stage of project planning, initial plans are developed that serve as the basis for drawing up the project budget, determining resource needs, organizing project support, etc. Planning always precedes control and is considered the basis for its application, because allows you to compare planned and actual indicators.
Planning is the most important process for a project, because the result depends on it. The scope and detail of planning depend on the usefulness of the information that can be obtained during the implementation process and is determined by the design of the project itself. The planning process cannot be fully automated, because it has a lot of variable parameters. Plus, it can be influenced by random factors.
In addition to this, project planning consists of a number of basic and auxiliary processes.
Main processes (always present):
- Planning, documenting and describing the scope of the project
- Determining the main stages of the project and breaking them down into smaller components
- Budgeting and estimating the cost of resources required to implement the project
- Definition and compilation step by step plan actions ensuring the project
- Determining the sequence of work
- Determination of technological dependencies and restrictions on work
- Estimation of work duration, labor costs and other resources required to complete individual works
- Resource planning (determining the type of resources for project work and their volume)
- Determining the timing of work under conditions of limited resources
- Formation of a budget and linking costs according to estimates to specific types of work
- Development of a project plan
- Collecting the results of other planning processes and organizing them into a single document
Supporting processes (present as needed):
- Planning and setting quality standards and determining how to achieve them
- Organizational planning, which includes the definition and distribution of functionality, responsibility and norms of subordination
- Selecting the people needed to implement the project and forming a team
- Establishing the communication and information needs of project members
- Identification, assessment and documentation of project risks (establishment of uncertainty factors and the degree of their influence on the project, identification of favorable and unfavorable scenarios for project implementation)
- Logistics planning (what, when, where and how to purchase and deliver)
The plans (networks and schedules) that represent the results of planning must ultimately be built into a pyramidal structure that includes all the necessary information, differentiated by levels, deadlines, etc. Project planning and systematization of plans are built on the principles of “feedback”, which ensures regular comparison of planned and actual information and gives the work more efficiency, relevance and flexibility.
Principles of Project Planning
Decisions made and actions taken in the field of project planning are based on several important principles:
- The principle of purposefulness. It is expressed in the fact that the project is aimed at achieving ultimate goal project initiator (person, group of people, organization, etc.)
- Systematic principle. It assumes that the project is managed as a single whole with its own characteristics of formation and development, but at the same time can be divided into subsystems with their subsequent study, because they are all interconnected and affect each other and the entire project. This allows you to find and create useful connections between subsystems and their effective relationships, to present qualitative and quantitative assessments of the process of implementing the entire project and its individual elements.
- The principle of complexity. According to it, phenomena are considered taking into account their dependence and connection, different methods and forms of management are used, the entire set of project management goals is considered at various levels and in various links, individual elements are linked to each other and correlated with the main goal of the project.
- The principle of security. It means that all activities provided for by the project must be equipped with all the resources required for their implementation.
- The principle of priority. He says that when developing a project and its implementation, the main attention should be paid to the primary tasks determined by the general concept of strategic development.
- The principle of economic security of planned events. Economic security should be calculated taking as a basis the probability of losses and damages as a result of the non-fulfillment of the event planned by the project. No innovations in work can eliminate risk, which is why in the practice of project development and planning it is necessary not to avoid risks, but to consciously take justifiable risks in order to reduce them to the maximum possible level.
In addition to the principles that we have named, it is also important to take into account the consistency of the tasks and interests of all persons involved in the development and implementation of the project and the timeliness of achieving the set goals within the prescribed time frame.
Taking into account the features of project planning and the above principles, you can move on to the next at least important issue- partitioning design work into components.
Work breakdown structure, responsibility matrix, cost items
A work breakdown structure (WBS) is a hierarchical structure for sequentially breaking down a project into subprojects and sets of detailed work at different levels. A project management system is the main tool for creating a project management system that allows you to solve various organizational problems, distribute responsibilities, estimate costs, create a reporting system, support the collection of data on the performance of work and display their results. Also, with the help of CPP, it is convenient to coordinate the project plan with the needs of the customer.
For the project manager, the project management system is no less important, because allows:
- Determine work and work packages to achieve intermediate goals
- Be aware of whether all project goals will be achieved
- Create a suitable reporting structure
- Determine project progress milestones
- Distribute responsibility among performers
- Provide team members with an objective understanding of all project tasks and goals
Complexes (packages) of work correspond, as a rule, to the lower level of detail of the work permit and include detailed work, which in turn can consist of steps. Detailed work and steps are not elements of the WBS.
The WDS can be developed top-down (from the main to the specific) and bottom-up (from the specific to the main), or using both approaches. Information for the development of the WDS can be identified using. The final WDS must take into account all the goals of the project and the prerequisites for its implementation.
The detail of the project management system depends on the content of the project, the experience and skills of the team, the management system, the principles of distribution of responsibilities, the reporting system, etc. To create a WDS, functional and technical specifications with general requirements to work.
Thanks to the hierarchical structure of the project, which is based on the WBS, it is possible to use procedures for collecting and processing data on the progress of project work in accordance with milestones, work packages, etc. It also allows you to summarize information on deadlines, resources, costs and schedules.
The compilation of the SRR can be based on the following bases:
- Stages life cycle project
- Peculiarities organizational structure
- Components of the result (product, service, etc.) obtained after the implementation of the project
- Functional or process elements of the activities of the organization that implements the project
- Geographical location (if projects are distributed spatially)
IN practical activities Almost always, combined WBSs are used, created using several bases, and the WBS must include all the work of the project, including detailed work and steps.
One of the most important stages in building a WBS is the analysis of its completeness, so if the project contains work that is controlled not only by the project manager, but also by the customer, they should also be included in the WBS - this will ensure the completeness of the structure.
Taking into account information about the plan of project activities, the breakdown of the project work schedule is carried out according to the criteria and characteristics of the project. The breakdown occurs until all the important activities and elements of the project are identified so that it is possible to plan them, determine their budget, draw up a schedule and an action plan for their control. To simplify and automate the CPP, all its elements need to be assigned an identifier corresponding to the level number. Identifiers should reflect the work breakdown criteria.
It is equally important to avoid a number of mistakes when structuring a project, namely:
- Skip the structuring stage and move on to finding solutions to current problems
- Use only organizational units, phases or functions in the structuring process, and not final products or applied resources
- Forget that the project management system should cover the entire project, omitting the initial and final phases of the project and the work of individual departments
- Repeat structure elements
- Forgetting to integrate the project structure with the preparation system project documentation and management system financial statements
- Over- or under-detailing the structure
- Create a structure so that it is not subject to computer processing (all elements or levels of the plan must have appropriate coding)
- Do not take into account “intangible” final products, for example, services, services, etc.
The project management system is the basis for team members to understand the essence and dependencies of project work, ensuring the subsequent coordinated work of all departments.
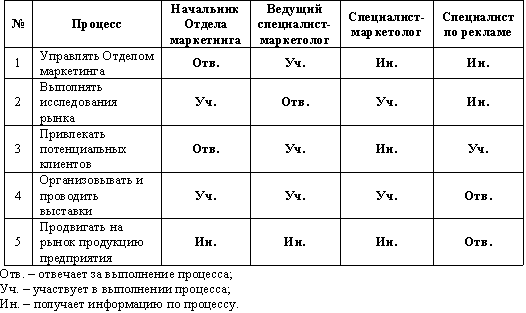
The responsibility matrix mentioned above and structural scheme organization (CCO) implementing the project are two tools that help the project manager create a team that meets the tasks and goals of the project. The use of SSO and SRR in constructing the responsibility matrix is clearly shown in the following figure:

The composition and plan of the project work greatly influence the form of the organizational structure necessary to achieve the project's goals.
The responsibility matrix allows you to ensure and agree on the structure of responsibility of team members (divisions) for performing work. In essence, this is a form of description of the distribution of responsibility for carrying out project work, where the roles of team members and/or departments are indicated. One axis of the responsibility matrix displays a list of work packages for construction work, and the other - a list of performers responsible for their implementation.
The elements of the matrix are codes for types of work from a list compiled in advance (you can also enter the cost of work into the matrix). The scope of responsibilities is determined by the specifics of the project and its organization, but it is recommended to use a small set of activities that are easy to understand and describe. Below is an example of a responsibility matrix:
The responsibility matrix can display the types of responsibilities of managers and the roles of people who help in the implementation of the project, but do not directly participate in it. If the matrix is drawn up correctly, it will become an excellent tool that ensures both effective execution of work and successful support by internal and external resources.
Persons responsible for the execution of work are appointed when planning the project, because It is necessary to have an idea of available resources even before taking action to implement the plan. Once resources have been identified, it is necessary to determine how they can be obtained; in particular this concerns labor resources.
The appointment of employees is carried out in stages - first a working group is formed, and then a project team, because it is the working group that will become the backbone of the future team. The composition of the working group is determined by the tasks and goals of the project. The group almost always consists of managers, influential members, and key personnel.
The working group takes part in project initiation and planning. At this stage, it is not yet possible to determine resources, because there are only general information about the project, and more detailed data will be obtained after detailed work has been carried out and the construction work permit has been created. The final appointment of performers and determination of their functionality will take place only after the final development and approval of the plan.
To properly assign responsible persons, you need to be aware of several types of resources that can be used:
- Labor resources
- Financial resources
- Equipment
- Technical equipment
- Technology and information
- Suppliers and materials
Despite the fact that performers do not always have all the levers for managing and using resources, knowledge of the seven types of resources greatly simplifies the process of describing a project and deciding on the distribution of responsibilities, because, as already said, work packages must be provided with everything necessary for their implementation . And to do this, it is important to answer two questions:
- What specific resources are required to implement all the work on the project (a list of requirements can be obtained using the work schedule and work schedule)?
- What do you already need?
Once these questions have been answered, the final allocation of responsibilities can be made.
Here we must talk about an additional means of planning project work - the structure of cost items. It should not be confused with accounting accounts, because... according to the articles included in it, unconfirmed documented management information necessary for adoption is classified and collected management decisions(meaning that there is no documentation confirming actual costs, but there is preliminary data on the resources used, work performed, etc.).
Cost items are a management tool that is used to collect data on the actual costs of work performed and then compare them with the costs according to the plan. The same articles are used for planning and controlling time and cost, because include information about the work assigned based on the WBS. Below you can see an example of the formation of cost items for work packages for which specific departments are responsible (based on the WBS):

Cost items may include data for multiple work packages based on different bases, such as:
- Responsible persons
- Account structure
- Deadlines
- Contents of work
Summarizing all of the above about cost items, it only remains to note that they contribute to the formation and monitoring of the project budget, the implementation of the current management accounting and assessment of possible costs after completion of design work.
We can now move on to consider the most effective methods planning projects to ensure timely implementation of both the project as a whole and its individual stages.
Network project planning
Methods of network project planning or, as they are also called, network diagrams (graph network, PERT diagram) are a graphical display of project work and the dependencies between them. The concept of “network” here refers to the full range of activities and control points of the project with established dependencies between them.
Network diagrams display a network model as a graph with a series of vertices that correspond to activities, and lines connecting them show the relationships between these activities. A graph, often called a precedence-follow diagram or a vertex-job network, is considered the most common representation of a network. Below you can see an example of a fragment of such a graph:

There is also a type of network diagram called a vertex-event network, but in practical work it is not used very often. In this case, the work takes the form of a line connecting two events (graph nodes) representing the beginning and end of a certain work. A good example Such a diagram is a PERT diagram - here it is:

Network diagrams are often confused with flowcharts, but this is not entirely true, because... The difference between a network diagram is that it displays only the logical dependencies of activities, while a flowchart shows inputs, outputs and processes. There are also no repeating cycles (loops) in the diagram.
Network planning methods are methods aimed at minimizing the duration of a project. They are based on the critical path method (MCP or CPM (from the English Critical Path Method)) and the method of evaluating and revising plans (PERT (from the English Program Evaluation Review Technique)).
The critical path refers to the longest path in the network, and the jobs along this path are called critical. The minimum duration of design work depends on the duration of the critical path. The overall project duration can be reduced by reducing critical activities. Thus, delays in the completion of work entail an increase in the duration of the project.
Using the critical path method, you can calculate approximate schedules for completing a package of work based on the logical structure of the network and estimates of the duration of individual activities, as well as establish an overall critical path for the project.
There is also the concept of a complete reserve (reserve) of time. This is the difference between the late and early start or finish dates of work. Managerial essence The advantage of time reserve is that there is room to accommodate financial, resource or technological constraints, and the project manager can suspend work for the period available in the reserve without fear of negatively affecting the final completion date of the project. The slack time for critical work is zero.
A horizontal line chart where project tasks are represented by time segments with specific time parameters (start, finish, delays, etc.) is called a Gantt chart, and it is also an integral part of network planning. Here is her example:

For effective planning, it is convenient to use PERT charts, a network graph, and a Gantt chart. Same thing network planning implies a description of the entire project work in the form of a set of works with specific relationships between them. To calculate and analyze a network diagram, a set of network operations called critical path method procedures are typically used.
The network model is being developed in stages:
- Lists of design work are determined
- Work parameters are assessed
- Dependencies between jobs are established
Work lists need to be defined to describe all project activities, including all details. Work is the main element of the network model. Work packages define the activities that must be performed to achieve project results. The results are usually highlighted with control points.
Before developing a network model, you need to make sure that the lower level of the WDS includes all the work that guarantees the achievement of specific design goals. The network model is the result of defining dependencies between activities and adding connecting events and activities. In its most general form, the approach presented is based on the assumption that any work is intended to help achieve a particular goal. Connective work does not necessarily have to be aimed at achieving a material result, because their goal may be to organize a particular event, etc.
The main task of the project manager is to evaluate the parameters of the work. For this purpose, other project participants responsible for completing individual project tasks may be involved. Assessing the duration of work and the need for financial resources and resources most directly affects the relevance of resource and cost plans and schedules, which are drawn up after analyzing the network model. Such an assessment must be carried out for each of the works. Then, on its basis, the levels of SRR in the project plan are generalized and formed.
In order for individual stages of the project and the entire project as a whole to be implemented on time, it is also necessary to plan the project according to time parameters. Let's consider this issue in more detail.
Planning a project based on time parameters
Time parameters should be understood here as the time periods during which work and work packages are planned to be completed, as well as control points of the project implementation process. Time - most important factor, affecting the effectiveness of the implementation of the entire plan.
The timing of the implementation of project elements and the entire project is always planned in advance, and, of course, it is desirable to minimize them. But minimizing deadlines is limited by three parameters: technical capabilities, technological requirements and quality of work. All this must be taken into account when planning.
Planning according to time parameters is a key element of project management, which includes several components. These components are:
- Concept of project management based on time parameters
- Project scheduling
- Monitoring the progress of design work
- Analysis and regulation of work progress
- Closing project management
It is often difficult to complete a project within a given time frame. The reason for this is a unclear understanding of what exactly needs to be managed, and most of the problems arise at the planning stage.
The reason for discrepancies with the schedule may be delays in deliveries, lack of resources, etc. If the scope and subject areas of the project are incorrectly determined, subsequently adjustments will have to be made to the work and schedule.
When a manager is dealing with typical recurring projects, it is convenient to accurately determine the time and sequence of actions, although in practice projects are repeated extremely rarely.
If we talk about the reasons for temporary losses in a project, they include:
- Inadequate quality and budgeting management
- No contingency plan for unexpected costs
- Poor distribution of risks among project participants
- Lack of structure in the communication system
- Difficult to implement project reporting system
Another important component of project management based on time parameters is the management of personal time resources. This is relevant for every performer and project participant, but it is more important for the manager, because he is responsible for the success of the project, which means he needs to have time to do a lot of all kinds of work.
To improve personal time management, it is advisable to use so-called forms. The form is a list of work required to be completed, indicating the performers and deadlines. The highest priority work should be moved to time blocks of the planning calendar. A planning calendar might look like this:


Unscheduled events or lower priority work can be added to empty time blocks. In cases where the scope of work more quantity time, work can be planned several days in advance. But you shouldn’t abuse this, otherwise there may be delays in completing high-priority tasks. And given that low-priority work may increase in priority in subsequent days, all tasks should be completed on time.
To do this, you need to correctly set priorities and act in accordance with them. The project manager should not be distracted by secondary and unclear tasks and procrastinate in making important decisions. He must also be able to delegate authority.
And the last thing we will focus on in the first lesson is some organizational issues.
Organization of project planning work
Project planning is the process of forming decisions that determine the sequence of project work and activities. It plays a dominant role in project management, representing the organizing beginning of the project implementation process.
Project planning includes several stages:
- Setting goals and objectives
- Resource calculation
- Creating a work duration schedule
- Optimization of the work schedule
- Organization of work execution
- Creation of a calendar plan for increasing the complexity of work
- Monitoring the progress of work
- Adjustment of work progress
The project implementation plan is comprehensive plan, containing a comprehensive system of tasks and goals, detailed work, actions and activities to achieve the main goal of the project. Great attention should be paid to drawing up an implementation plan, trying to avoid common mistakes, such as:
- Setting the wrong goals
- Using incomplete information
- Ignoring past experience
- Ignoring the issue of resource availability
- Lack of attention to coordination of project participants
- Ignoring the motivation of performers
- Excessive attention to plan detail
- Making a plan for the sake of a plan and ignoring control over adherence to the plan
Despite enough a large number of errors and their specificity, taking into account all the planning elements that we told you about helps to avoid them. It is only important to remember that project planning is a systematic arrangement of tasks, the purpose of which is to achieve the main result - the implementation of the project. And taking into account the fact that the plan always contains instructions for actions and the actions themselves, it can be safely considered a standard or guideline with which actual indicators will be compared. If, as a result of such comparisons, any discrepancies are found, it is necessary to take measures to adjust the plan.
In the second lesson we will talk about another important element of project management for a manager - team management. Issues such as the composition of project participants, the functions of a project manager, features of the formation and development of project team, characteristics and composition of a team, conflict resolution and a number of others.
Test your knowledge
If you want to test your knowledge on the topic of this lesson, you can take a short test consisting of several questions. For each question, only 1 option can be correct. After you select one of the options, the system automatically moves on to the next question. The points you receive are affected by the correctness of your answers and the time spent on completion. Please note that the questions are different each time and the options are mixed.